
Bitcoin (BTC) was able to gain back some lost ground on Feb. 24 but has yet to break out above an important resistance level at $56,000.
Bitcoin is expected to eventually break out over this level again to confirm that the trend is bullish.
Bitcoin Holds on Above Support
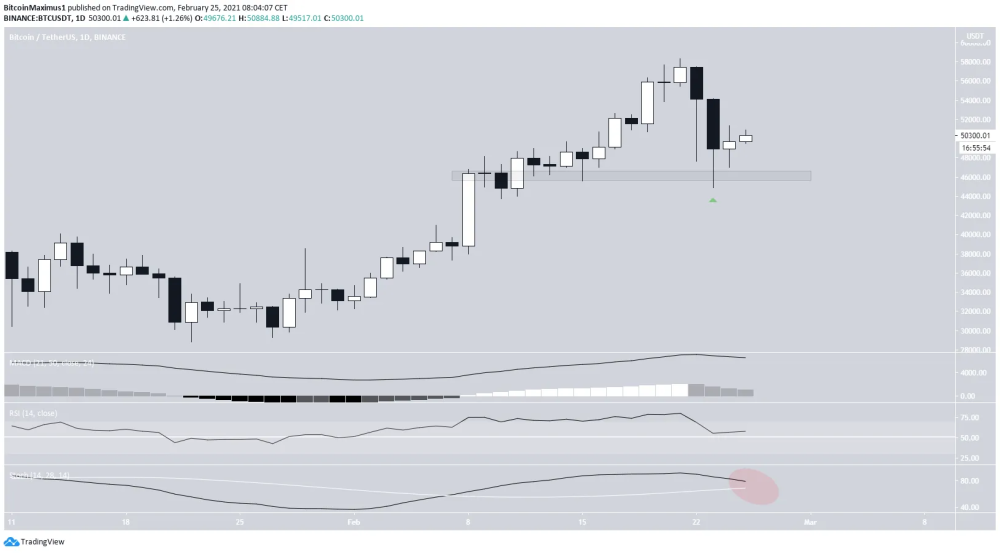
On Feb. 24, Bitcoin continued a modest recovery that started on Feb. 23 by creating a small bullish candlestick.
While BTC is still holding above the $46,100 support area, there are no definite bullish reversal signs.
On the contrary, technical indicators are showing a loss of momentum and are at a critical juncture.
The MACD histogram is close to turning negative, the RSI is just above 50, and the Stochastic oscillator is falling. The latter has nearly made a bearish cross in the process.
How these signals continue to develop will help in determining the direction of the trend.
A Bit of Relief
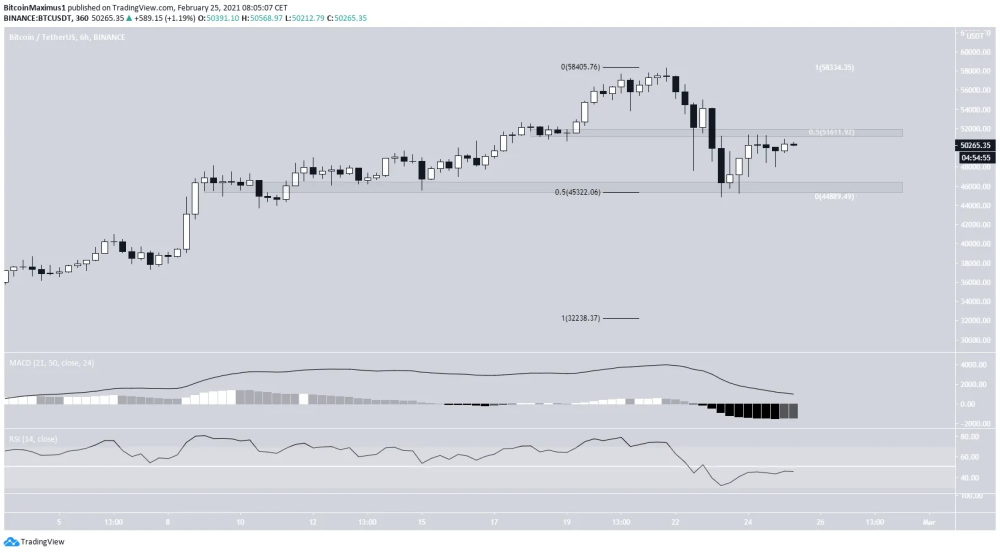
The six-hour chart shows that the bounce occurred right at the 0.5 Fib retracement level at $45,300.
Currently, BTC is trading in a range between the aforementioned support at $45,300 and the 0.5 Fib retracement of the previous decrease at $51,600 (shown in white).
Technical indicators are showing some bullish reversal signs, although they are not sufficient enough to confirm a breakout.
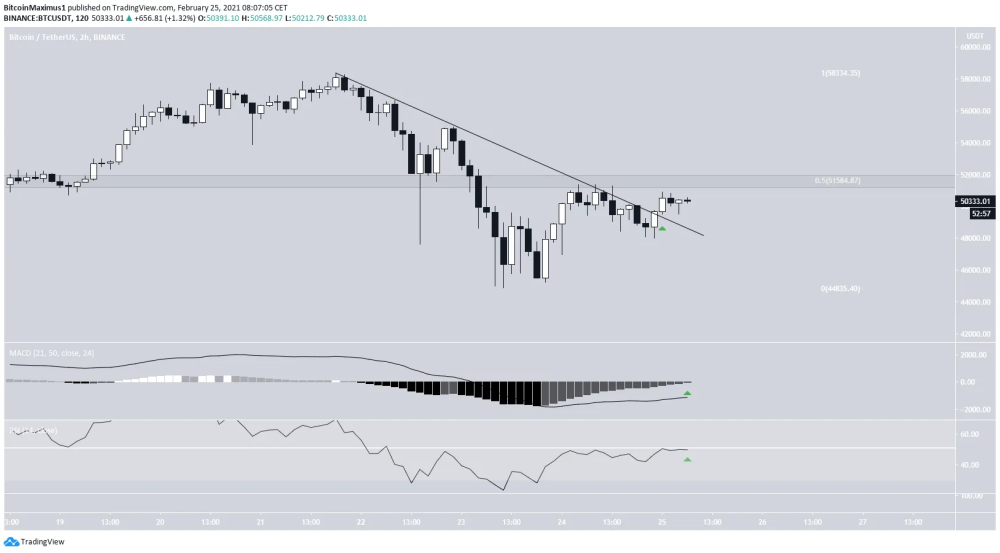
The two-hour chart shows that BTC has already broken out from a descending resistance line.
The MACD is nearly positive and the RSI is at the 50-line. A movement above the $56,000 resistance area would likely confirm that the trend is bullish.
BTC Wave Count
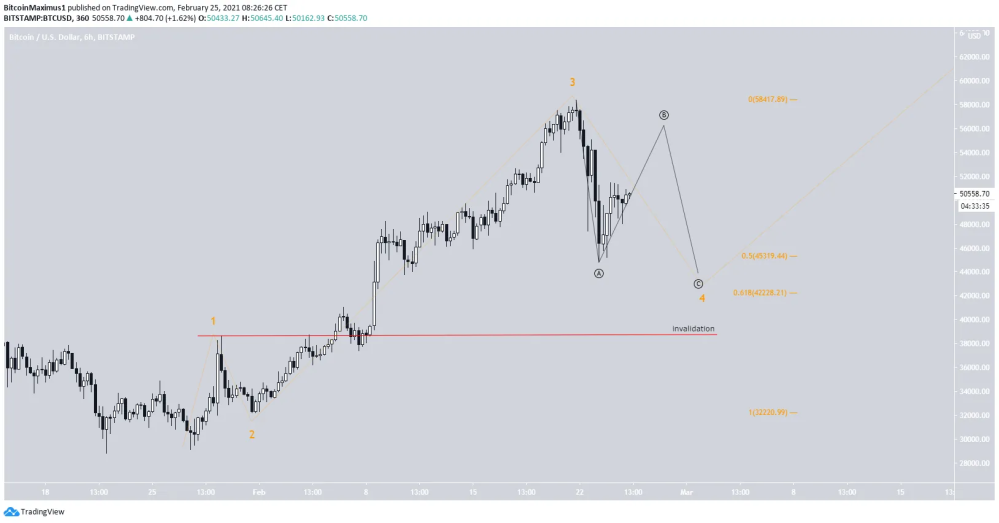
The wave count shows that BTC is in wave four of a bullish impulse that began on Jan. 30.
The Feb. 23 low was likely the end of the first portion of the correction, and BTC is now in the B sub-wave (black).
At the current time, we cannot determine where the bottom of the C wave will be. This is because the pattern could potentially be a regular, irregular or running flat correction. The possibility of a triangle also remains.
A decrease below the wave one high at $38,620 would invalidate this particular wave count.
Conclusion
While the short-term trend for Bitcoin seems bullish, a breakout above $56,000 would be required in order to confirm that the price is heading higher.
Where do you think the Bitcoin price is going?
Also, If you are interested in trading, I would suggest you try out BeInCrypto's free Telegram chat. I am there and it is growing very quickly over there. It's a place where they discuss the market and share interesting content. They also have a free premium channel where they have a cryptocurrency trading course and daily trading signals. If you are interested, you can click here.
Until next time, stay classy crypto world!


