
A 2010 Northeastern University College of Science study found that human behavior was 93% predictable. This figure is quite incredible when you think about it, and the director of the study said at the time that spontaneous people were mostly absent from the population:
“Spontaneous individuals are largely absent from the population. Despite the significant differences in travel patterns, we found that most people are equally predictable.”
The director of the study refers to travel patterns here because the study focused on the mobility patterns of anonymous users. While the common perception is that our actions are random and unpredictable, this study established the opposite.
This predictability of human behavior can be exploited in many other domains. It can be exploited in a field that will be of great interest to you: the prediction of asset movements in financial markets. When we carefully study the way an asset's price evolves, we realize that certain patterns frequently recur, and more interestingly, that the way the asset's price evolves afterward is identical to what happened previously.
This is where Mark Twain's famous quote comes into play:
“History doesn't repeat itself, but it often rhymes.”
By doing a thorough technical analysis of an asset's price movement, you can bring out these chart patterns that will allow you to make better decisions on what to do next.
While some fundamental investors are very critical of trading patterns as being nothing more or less than astrology, this is wrong in my opinion. If the charts of an asset's evolution are not magical in themselves, the way the human mind will interpret and react to these charts can be predicted in a more refined way.
This is where the study of human behavior I mentioned in the preamble comes into its own. It is the psychology of human beings that plays a major role in determining how markets will evolve. Since human behavior is mostly the same, you can define more or less precise strategies after having identified certain chart patterns.
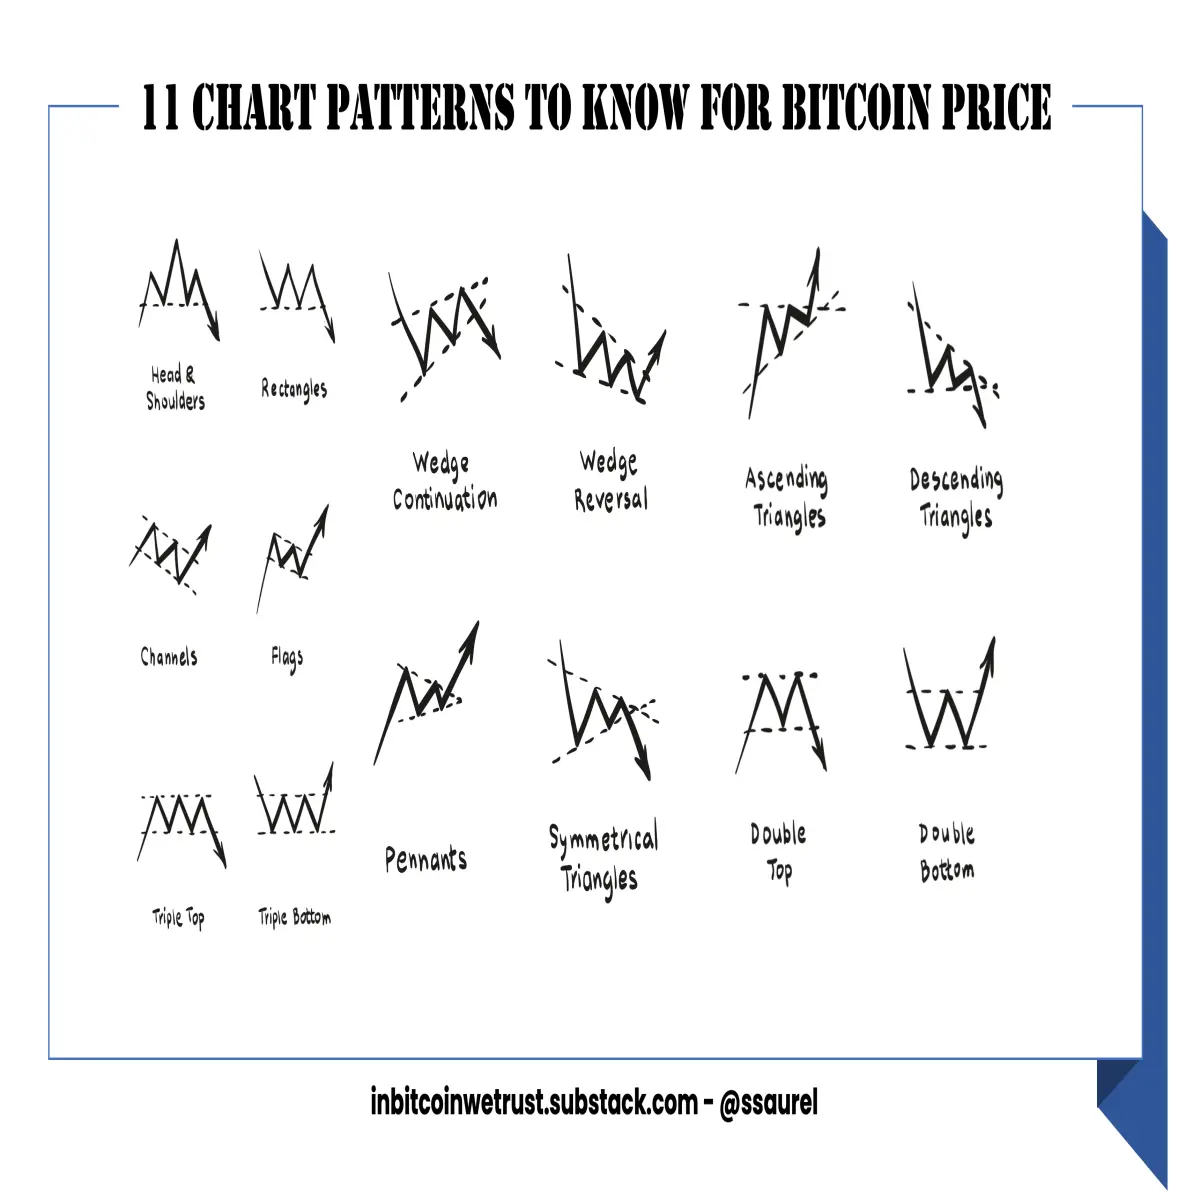
In the following, I will present you with the most common chart patterns that you need to know to better anticipate future developments in the price of Bitcoin. Note that this also applies to Altcoins if that's what you're interested in. Finally, be aware that these patterns become more effective the larger the number of participants in a market.
What applies to Bitcoin will not be as accurate on an Altcoin with very few participants.
The support and resistance lines are the fundamental notions to know before going further
Before going any further, I would like to define with you some fundamental notions that will be used later. A Bullish move means a potential uptrend for the price of an asset. A Bearish move means a potential downward trend in the price of an asset. Once you have determined these patterns, you can better position yourself to trade the asset in question.
In addition, to identify these patterns, you need to do technical analysis on the price of an asset by drawing support lines and resistance lines. A support line is a line where the price of an asset stops falling. Resistance is a line where the price of an asset stops rising.
Finally, you need to look at trading volume before confirming how accurate the chart pattern you identify is. For example, a strong upward movement that is not supported by a proportional increase in trading volume means that the asset in question may not be able to sustain this upward trajectory.
All the details on these 11 chart patterns to better anticipate Bullish or Bearish movements for the Bitcoin price are on this issue of the In Bitcoin We Trust Newsletter:
Final Thoughts
The 11 chart patterns that I have just revealed are the ones that come up most often. The fact that all traders know and use them increases the probability that the outcome will be the one expected. A sort of self-prophecy occurs, as everyone expects a certain outcome when the chart pattern appears.
With time and practice, you will be able to spot these different chart patterns. This will allow you to better anticipate the evolution of the Bitcoin price. You will be able to make your own decisions based on your technical analysis rather than listening to others point out these patterns.
I don't trade Bitcoin, because I am a HODLer. But I like to study these chart patterns for my readers. It's also exciting to see how market psychology can predict certain short-term price movements of an asset.
Of course, you can also use these chart patterns on the stock market. That's where they were first highlighted.
In Bitcoin We Trust Newsletter: Everything around Bitcoin, Blockchain, and the cryptocurrency market





