last night was an important one which I stayed awake till the UTC closing time (3:30 am my time!)
why? the bitcoin price shadowed below daily EMA55 during the day, I am holding some BTC and I have a long position since $9230; if the price would closed below the EMA55, it could be a very bad sign.
What happened?
the price stayed below the level till 3 hours before the candle closes and then bounced back. it was a meaningful support I believe. look at the chart below:
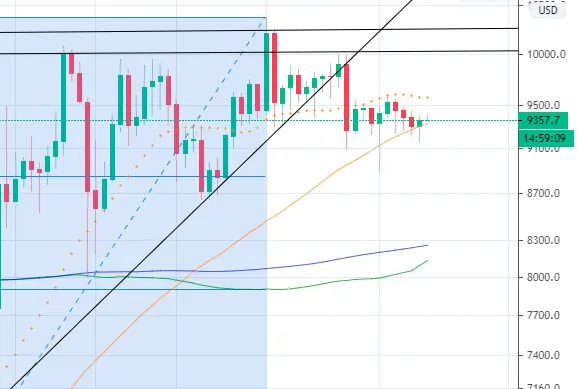
the orange line is the EMA55 and the chart is BTCUSD D1 (daily)
next resistance which I'm somehow expecting is EMA21, currently at $9540, roughly.
I don't like to overuse indicators and signal generating tools, I believe in classical technical analysis which is based on support/resistance and price action analysis. therefor I just draw moving averages and Fibonacci ret. and watch the candles!
keep up the good work buddies, and don't forget this was not a financial advice! just telling you what I see and share you some thoughts.
I may publish my posts in my other social media accounts, everywhere same username: @honarparvar






