I'll try to keep it simple:
- 4hours chart had a bullish divergence which resulted in recent rise (more than what I expected here in this post: https://www.publish0x.com/honarparvar/bitcoin-is-about-to-dive-again-xoonnxg)
BUT we have a negative (bearish) divergence now in the 4h which is not yet filled, so in the daily chart we expect a pick, as the indicator is also overbought.
if that happens (which is very probable) there would be a bearish divergence in daily chart, between 16 Jan pick and 6 or 7th Feb (22 bars distance, which is not very close)
I assume the drop is like a pullback to the rising wedge which broke beautifully (point A in the chart)
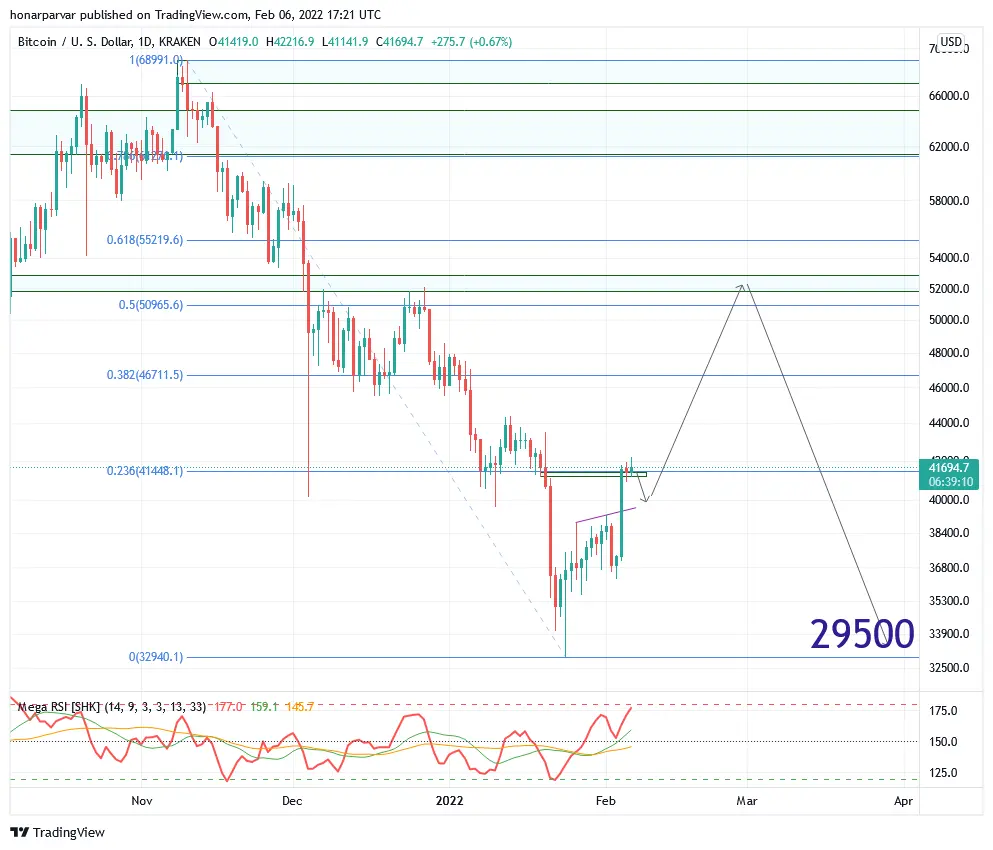
then there would be another rally up, probably to the 50% to 61.8% fibo level (ATH to 24 Jan dip) which is around $51 - $55K
Or even if a new all time high happens (which would be $74k)
but I am very bearish once one of these targets achieved.
WHY?
if the move limits to $55K, in the weekly chart there would be a head and shoulders pattern:
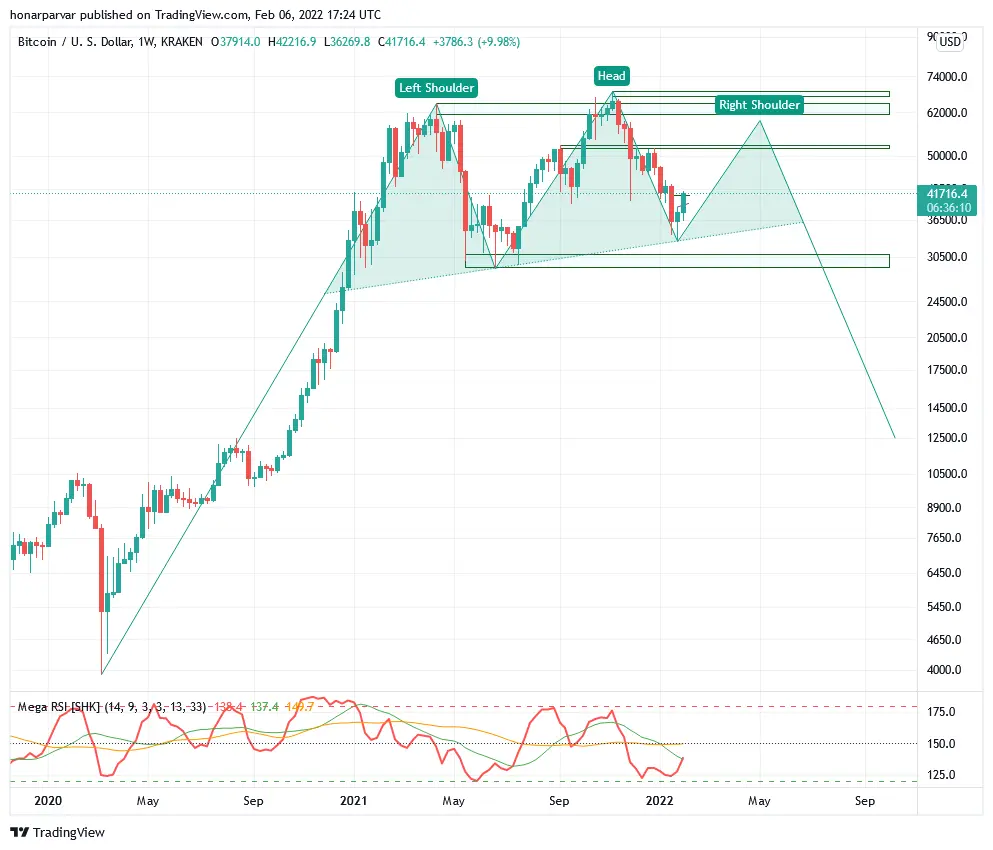
if a new all time high shows up, there would be a three-drive pattern:

I will keep this thoughts updated in my blogs (Publish, steemit and hive) also on my twitter and TradingView accounts. you can find me all these places @honarparvar :)






