
Knowing chart patterns helps you buy in and sell out in the right times.
I don't encourage anyone to day trade, but even for medium to lung run holdings, entry point plays an important role.
bears and bulls
These are normal bullish and bearish signs and patterns.
For example:
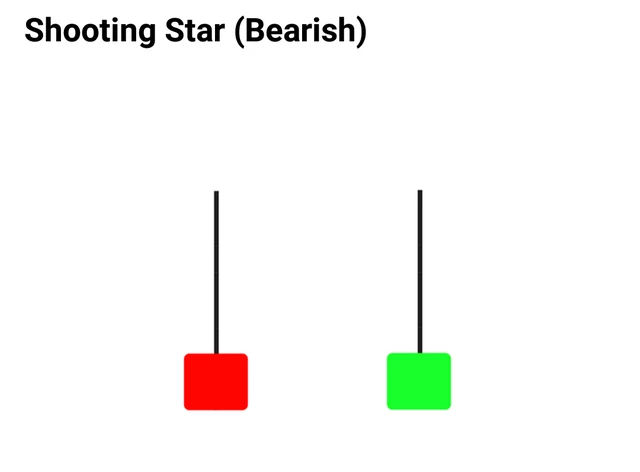
Shooting stars are bearish signs
and
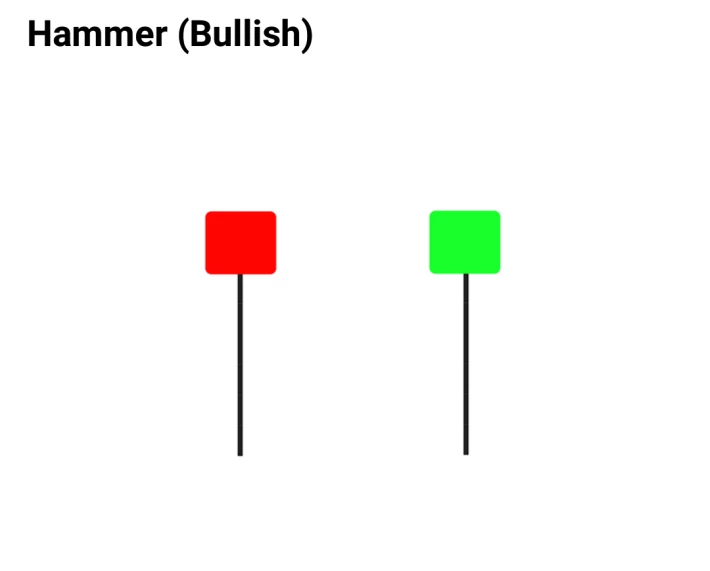
Hammers are bullish signs.
How to trade?
When you spotted one of these patterns, wait for the next candle; hammers should be at the bottom of a down trend and shooting stars vice versa.
Upon confirmation on next candle, you can open a long postion (or short for shooting star)
If you are watching a weekly chart, you may need to wait for couple of weeks. If you are on a daily chart, couple of days and so on.
Good luck and mind your trades, with your own responsibility 🤞😉
The purpose of this blog is just giving you awareness and knowledge, not financial advice.
This post was originally published in my steemit account, @honarparvar, link is included in the resource tab.






