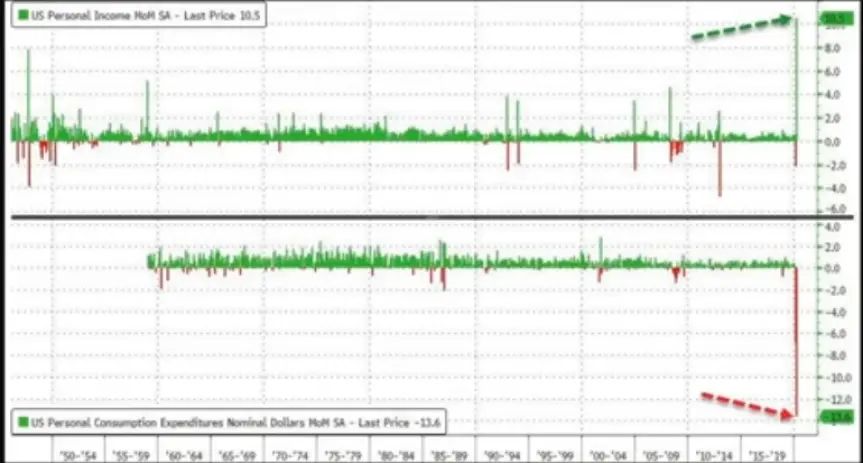
The first graph shows the savings rate of the Americans. It is on the rise, which explains why Americans are saving more and more.
And the second one at the bottom represents the expenses of American households, which are in total decline, unheard of since the 1950s.
But is this due to the helicopter currency? We should also see spending explode. This more reflects a fear of Americans on the future of the economy.
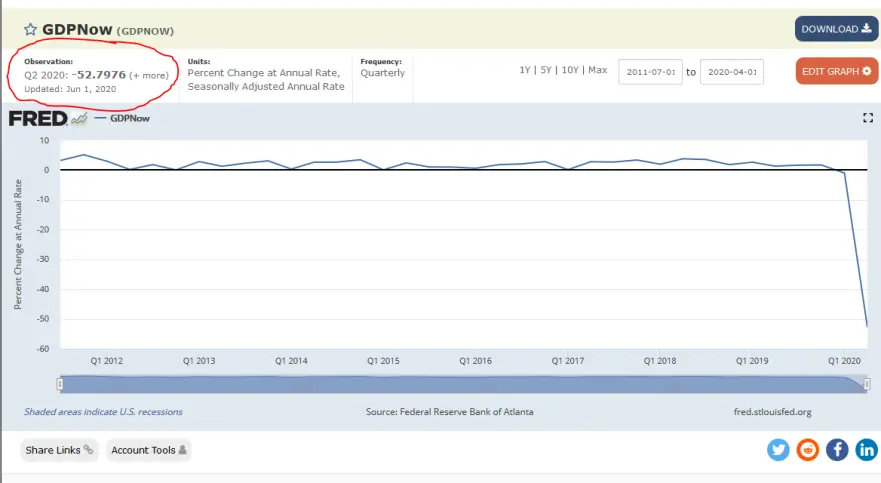
The GDPNOW is an indicator on the American GDP, we see on this graph a decrease of 50%, compared to last year, it is not good to see. There is also an increase in the unemployment many companies have been stopped, but hey the markets continue to go up, look for the error ...