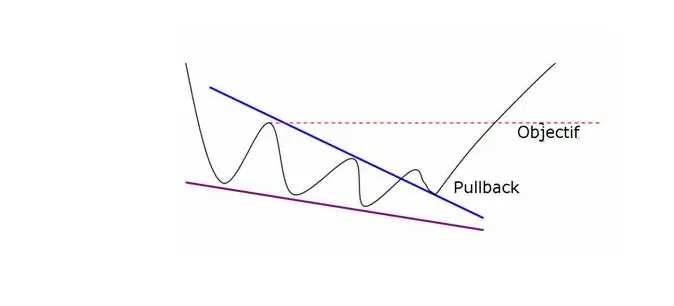
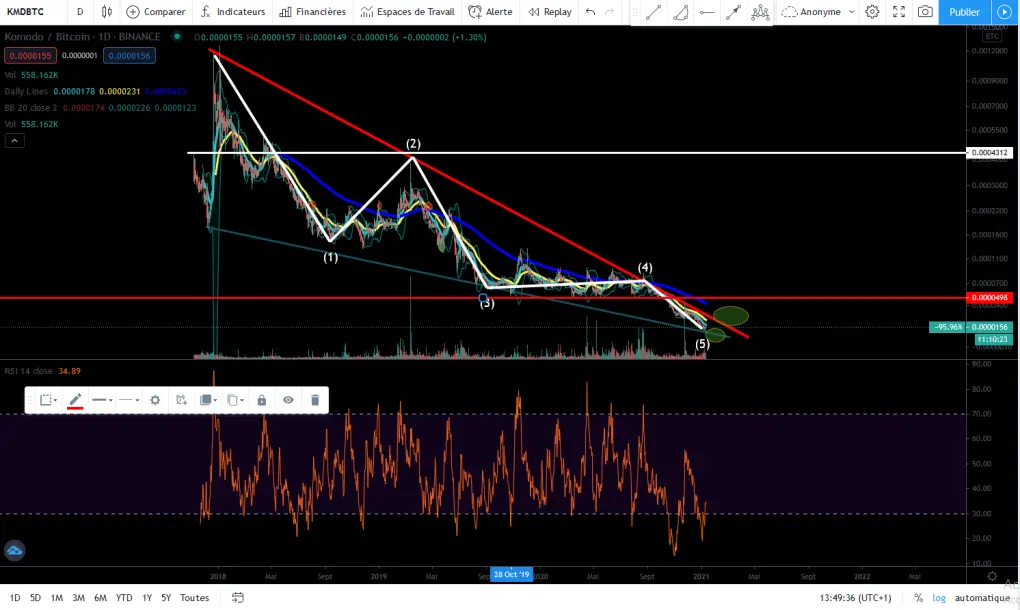
Hello , Today I will show you an example of a "falling wedge", or the graphic representation of a wedge descending 5 waves. I take the example of Komodo that I have already been monitoring for a while when there is this technical configuration. These are figures that I like because the potential is interesting but there is often a risk because these are against trend trades which are very dangerous. It is necessary to take care of its entry point, the best often is to take either at the bottom of the bevel or to take the break of the bevel on the rise. This correction in the crypto market makes me think that it is soon the right time because we see abandoned crypto like Zcash where there has been a resurgence of interest.
Often these figures can also take place differently with a break of the bevel from the bottom and then a reintegration of the bevel to start upwards. Often in this kind of case we take wave 1 and wave 4 and we draw a line which gives the goal. I'll give you an example of a trade I made a few months ago on Fantom.
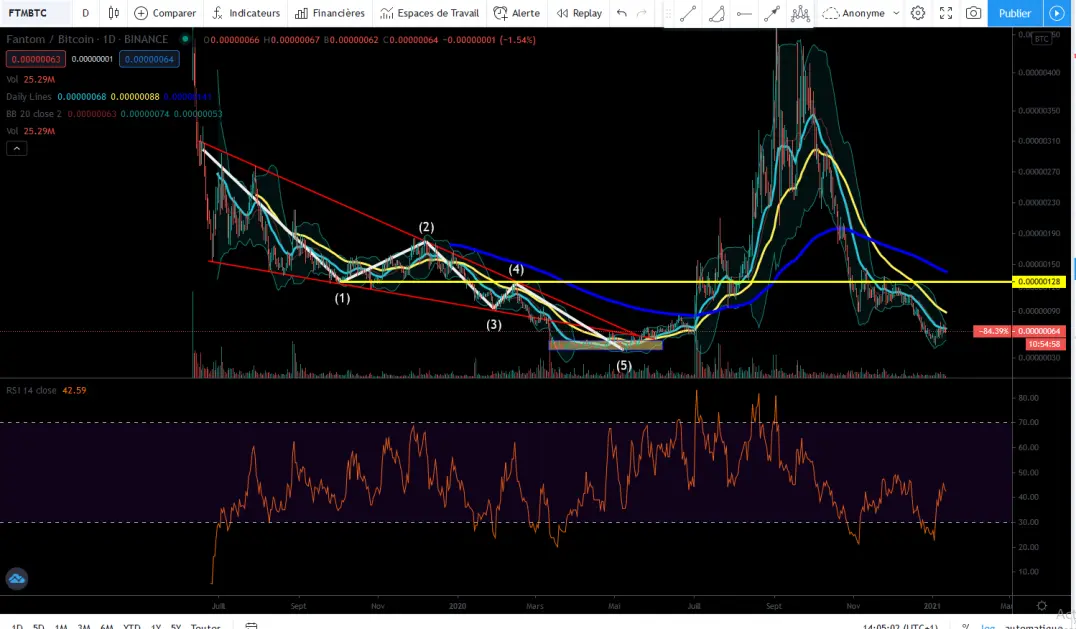
On this trade I got out a bit early, with 100% profitability. I made the mistake of TP everything when the normal strategy is to do partial TP like 50% when we made 100% to recover setting and let the rest run.
Descending wedge statistics
- In 82% of cases, the exit is bullish.
- In 55% of cases, the descending bevel is a turning figure.
- In 63% of cases, the objective of the pattern is reached when the resistance line is broken.
- In 53% of cases, the price carries out a pullback in support on the resistance line of the descending wedge.
- In 27% of cases, false breaks (false exits) appear.