Dollar bitcoin, 1D graph with divergences in Shorts
We find a graph that shows the madness in the shorts the frame of 1 Day, it is a VERY DANGEROUS question to open shorts at this height, a divergence with the RSI is saying enough to the selling force, this does not mean that when the shorts fall On the other hand, we have the Longs very low, this will be something simple, close short, raise the long, liquidate the few shorts that remain and then the Market will go down the projection is 1 Week
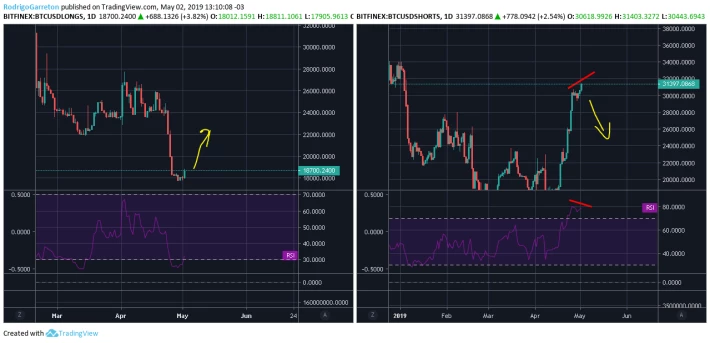
In short the short term position is Long, then a short to 4400 could be a good idea






