In my last two articles, I explained the different areas of resistance that we would certainly face.
Two days ago, I indicated a possible resistance zone around $85,000 (see article). This resistance was smashed in 24 hours pushing the price of Bitcoin above this price level. We then gradually climbed to $86, $87, $88, and $89,000 before locking in just above $90,000. This spectacular climb took place in just a few hours. As I indicated to you yesterday, the $90,000 may act as a new price-blocking level (see article).
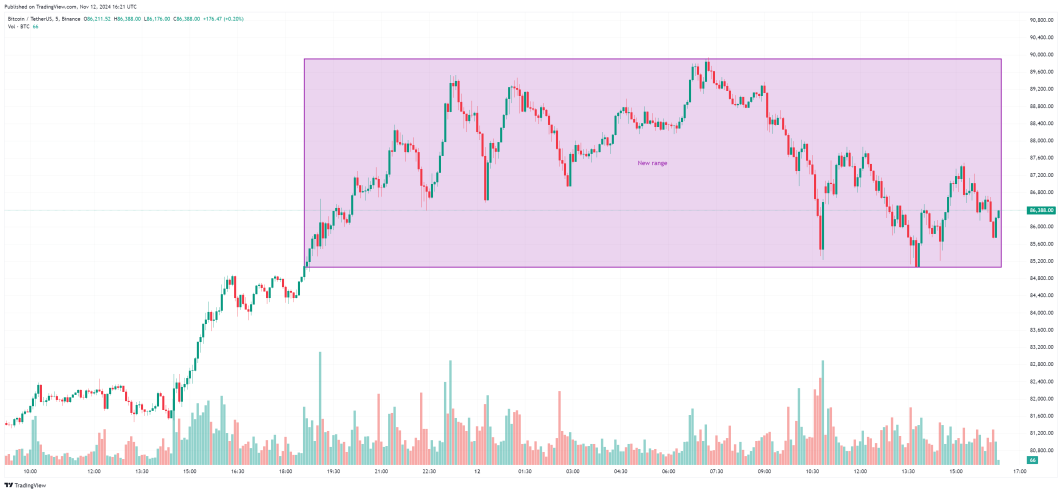
What is very interesting about this chart is that we can clearly distinguish a support zone of prices and a resistance zone of prices over the last 48h. The $90,000 acts as a new area of resistance in the short term, while our old $85,000 resistance acts as a new area of support. This is a short-term trend for daily traders with a new buy and sell area that is as follows:
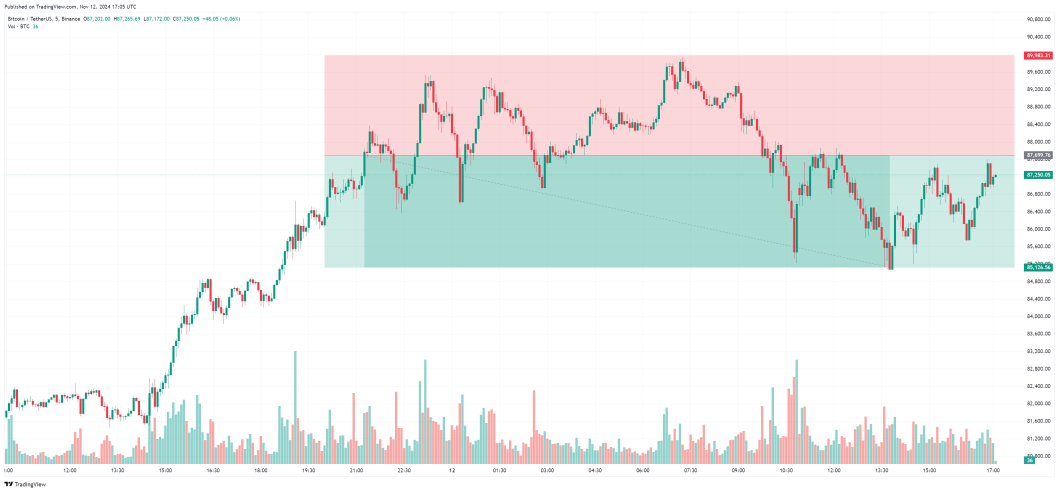
These indicators are very short term and may change tomorrow. They are not long term indicators. As we have entered a price discovery zone (never reached) for a short week, nothing is certain and we have little back-tracking on the likely market reactions. If the market ever falls, the $80,000 area could serve as support but if we ever break the resistance of $90,000, it is likely that the market will stop net near the $100,000 by slowing slightly to around $95,000.
The rsi remains very high (approximately 75), but it could slightly decrease with the day’s stabilization. The 'Fear and Greed' index rises to 80, which shows a strongly optimistic sentiment for the crypto market. Given the high level of volatility in the market today, we need to keep track of price trends on a daily basis. Tomorrow everything could change. Remember to subscribe to be kept informed.