
Bitcoin (BTC/USD) weekly chart is showing a potential bearish reversal. The uptrend could be completed after 5 bullish waves up. 
The Bitcoin (BTC/USD) weekly chart is showing a potential bearish reversal. The uptrend could be completed after 5 bullish waves up.
We also review the EUR/USD downtrend and GBP/AUD triangle pattern on the daily charts.
Bitcoin Bearish Momentum vs Uptrend
The BTC/USD chart remains in an uptrend but the bearish pressure is placing it under severe pressure. The higher high was quickly followed by a fast decline:
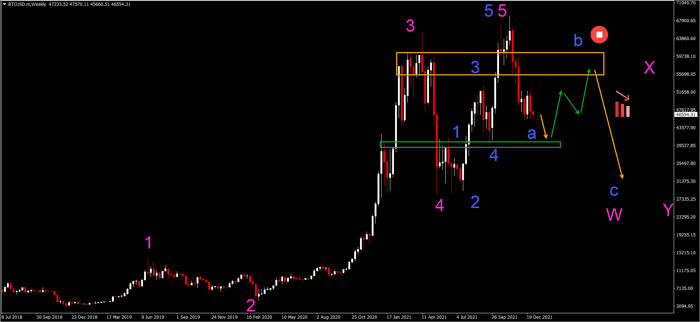 04.01.22 waves BTCUSD
- A 5 wave (pink) pattern seems to be completed. There is also a clear 5 wave pattern (blue) in the final 5th wave (pink).
- Price made a higher high but the bulls were unable to hold ground. The quick bearish decline showed a lot of bearish momentum. The bearish drop could be a wave A (blue).
- A new lower low is expected (orange arrow) to test the support zone (green) first. A bullish bounce (green arrow) could test the resistance zone (orange).
- A bearish bounce at the resistance would confirm that the uptrend is indeed over.
- A larger, complex bearish correction could take place via a WXY (pink) pattern. In case, the uptrend continues, then it is likely that a triangle pattern will emerge first.






