
 Crypto market was slow over the weekend, so our view remains unchanged.
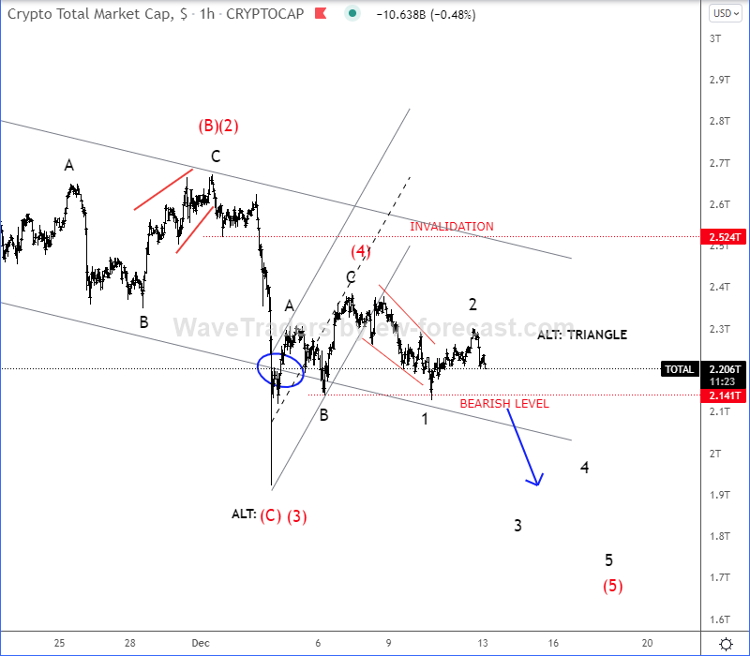
We are still looking for more weakness after recent sideways and corrective wave structures. If we take a look at Crypto total market cap chart, we are still tracking wave (4) correction that can be already completed or still in progress as a bearish triangle pattern. Anyway, in both cases we can expect more downside pressure within wave (5) in upcoming days, which should be completed by a five-wave cycle of the lower degree.
Crypto Total Market Cap 1h Elliott Wave Analysis
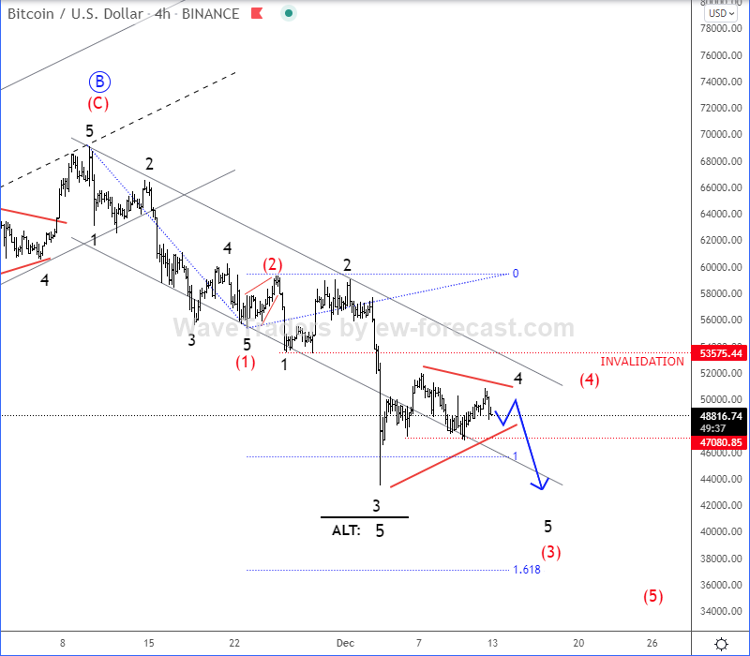
Bitcoin, BTCUSD is accelerating even lower in the 4-hour chart, seems like there’s now room for more weakness within a five-wave cycle for wave C, which can send the price much lower, ideally towards June Lows and 29k-20k support zone, just be aware of shot-term pullback in wave (4) that can be also a sideways consolidation within a bearish triangle pattern.
Bitcoin 4h Elliott Wave Analysis
However, according to quite big intraday recovery, we have also prepared count #2, where BTCUSD may have a completed five-wave cycle that can be now followed by a higher degree A-B-C pullback in wave (2) back to 57k resistance area before bears show up again.
Bitcoin 4h Elliott Wave Analysis






