
If you’re diving into Bitcoin (BTC) futures trading—or just trying to figure out what’s driving those wild price swings—you’ve probably stumbled across Open Interest (OI). It’s one of those metrics that sounds boring but can actually give you a serious edge. Today, we’re breaking down what BTC Futures Open Interest is, why it’s a big deal, and how you can use it to trade smarter. Let’s jump in!
So, What’s Open Interest Anyway?
Picture this: Open Interest is like a live tally of every futures contract out there that hasn’t been closed yet. We’re talking all the open long positions (folks betting BTC goes up) and short positions (those expecting a drop) across exchanges like Binance, CME, or Bybit. It’s not about how many trades happened—that’s volume—but how many bets are still on the table.
For example, say I buy one BTC futures contract (going long), and you sell one (going short). Boom—OI goes up by one contract. If I cash out later by selling it back, OI drops by one. Simple, right? It’s usually shown in USD or BTC terms, so you might see something like “$50 billion in OI” on a hectic trading day.

New bets, new OI!
Why Should You Care?
OI is like a secret decoder ring for the market. Here’s what it can tell you:
- Who’s Jumping In: Rising OI means fresh cash is hitting the market—traders are piling in with new positions. Falling OI? People are bailing out or taking profits.
- Trend Vibes: If BTC’s price is soaring and OI’s climbing too, that’s a sign the rally’s got legs. But if prices spike and OI dips, it might just be shorts getting smoked—not a real bull run.
- Reversal Radar: Weird mismatches between price and OI can hint at turnarounds. More on that in a sec.
- Liquidity Check: Big OI usually means tighter spreads and smoother trades. Low OI? Brace for some chop.
Trading OI Like a Pro
Alright, let’s get practical. How do you actually use this stuff? Here are some tricks to add to your playbook—complete with examples from the wild world of BTC.
1. Confirming the Trend
Imagine BTC’s been grinding up and finally smashes through $80,000 resistance on March 15, 2025 (hey, it’s possible!). You check CoinGlass and see OI jump from $45 billion to $50 billion. That’s a green light—new buyers are flooding in, and this breakout might have juice to hit $85,000. Time to go long?
Flip it: BTC crashes below $75,000 support, and OI spikes from $47 billion to $52 billion. Shorts are piling on, betting on more pain. Could be a cue to short it down to $70,000.
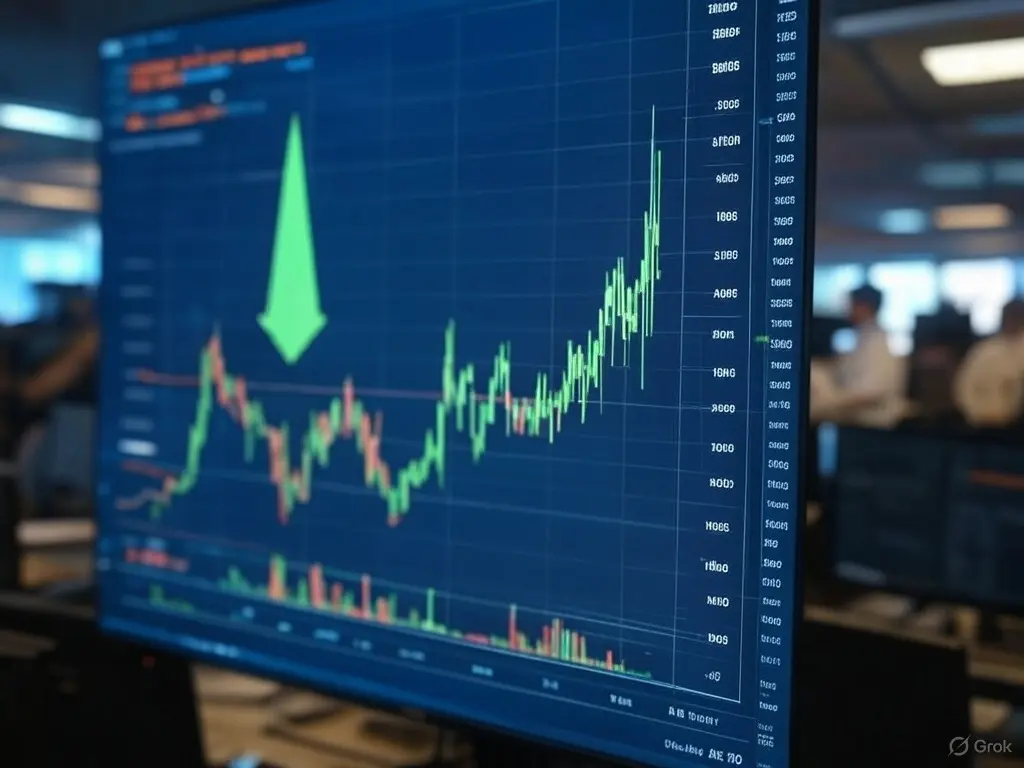
Price up, OI up—bulls are charging!
2. Spotting Overhyped Markets
Ever seen BTC moon like crazy, only to crash just as fast? OI can tip you off. Say BTC rockets from $76,000 to $85,000 in three days (March 17-19, 2025), and OI explodes by $10 billion. That’s a red flag—too many leveraged players are jumping in, and a liquidation cascade could be coming. Maybe sit this one out or scalp a quick short when it peaks.
Real example: Back in November 2021, BTC hit $69,000, and OI soared to record levels. What happened next? A brutal drop to $55,000 as overleveraged longs got wrecked. History loves to rhyme.
3. Catching Reversals
Here’s a sneaky one: divergences. If BTC hits a new high—say, $90,000—but OI starts flatlining or dropping, the party might be over. Traders are cashing out, not doubling down. I’d tighten my stops or look for a fade.
On the flip side, if BTC dips to $74,000 and OI creeps up, it could mean dip-buyers or shorts getting cocky. Pair that with a hammer candle on the chart, and you’ve got a solid long setup.

Price says go, OI says whoa.
4. Funding Rates + OI = Magic
In perpetual futures (the kind most crypto traders use), funding rates show who’s paying who—longs or shorts. High positive rates with big OI? Too many longs, ripe for a squeeze. Negative rates with rising OI? Shorts might be in trouble soon.
Example: Early March 2025, BTC’s at $78,000, OI’s climbing, and funding goes negative. Shorts are aggressive, but then price bounces to $80,000—bam, short squeeze. You could’ve snagged that ride with a quick long.
5. Exchange Detective Work
Not all OI is equal. CME’s got the suits—big institutions—while Binance and Bybit are retail central. If CME OI spikes while Binance lags, maybe the “smart money” sees something big. Retail OI booming? FOMO alert.
Real-World Example: March 2025 Scenario
Let’s play it out. BTC drops from $80,000 to $76,000 over a week (March 12-19, 2025). OI rises from $45 billion to $49 billion, and funding rates go negative. Shorts are in control, betting on a bigger fall. You short at $76,000, aiming for $70,000, with a stop at $77,500.
A few days later, BTC rebounds to $78,000, OI dips slightly, and shorts start covering. You close the short for a tidy profit and flip long, riding the bounce to $81,000. OI’s your co-pilot the whole way.

Short, flip, win—thanks, OI!
Watch Out For…
OI’s awesome, but it’s not perfect. Crypto’s a circus—liquidations, Elon tweets, or Fed announcements can flip the script fast. Plus, OI doesn’t tell you who’s opening positions, just that they’re there. Cross-check it with volume, liquidations, and your trusty RSI.
Where to Peek at OI
- CoinGlass: Real-time OI across exchanges.
- CryptoQuant: OI with extra sauce (like exchange flows).
- Glassnode: Deep dives for the nerds.
- CME Data: Institutional OI straight from the source.
Wrapping It Up
BTC Futures Open Interest isn’t just a number—it’s a story about what traders are feeling and doing. Whether you’re hunting trends, dodging blowups, or sniffing out reversals, OI’s got your back. Pair it with price action and a little gut instinct, and you’re cooking with gas. So next time you’re eyeing a BTC trade, give OI a glance—it might just save your stack.






