
Reflecting on the current state of Bitcoin, it's interesting to observe the formation of a spinning top around the downtrend line. This pattern, in conjunction with several key technical indicators, suggests a confluence of resistance that could potentially impact the coming weeks.
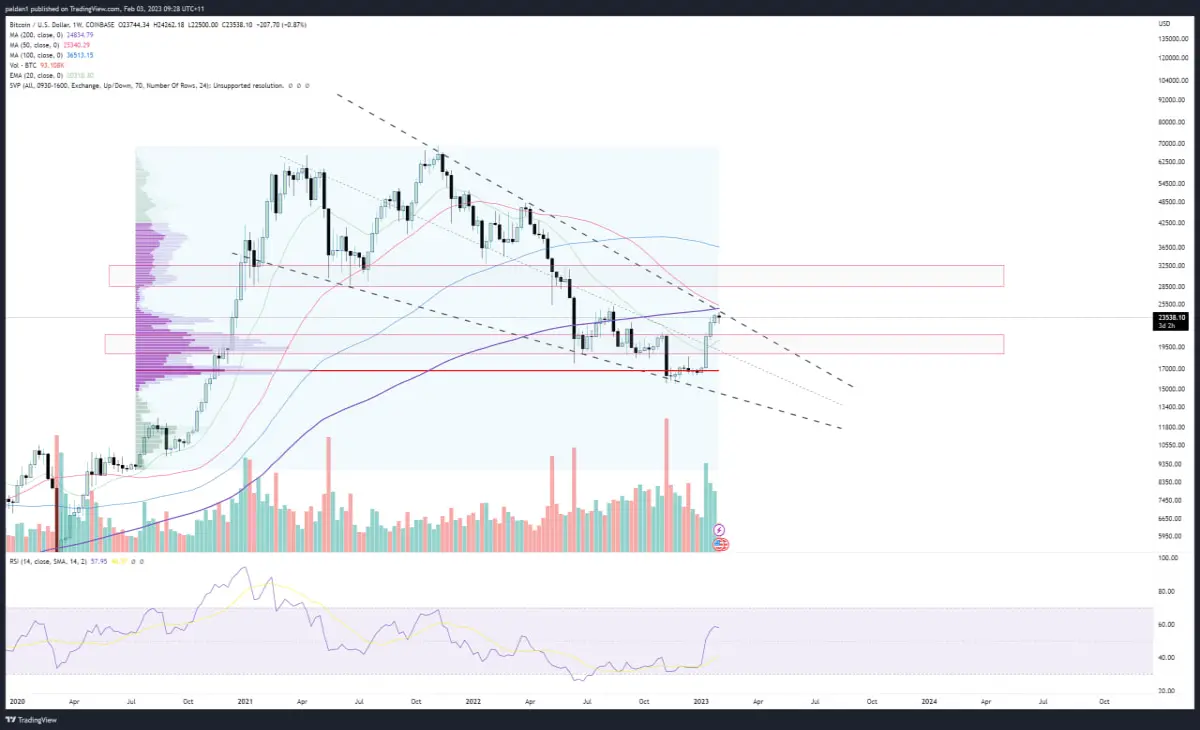
One of the key indicators to consider is the moving averages (MAs), including the 200-week MA, which serves as a long-term trend indicator for many traders. Another important factor to take into account is the 0.236 Fibonacci level, which is calculated from the weak right shoulder. This level often serves as another resistance level, and its presence at this point adds additional weight to the resistance scenario.
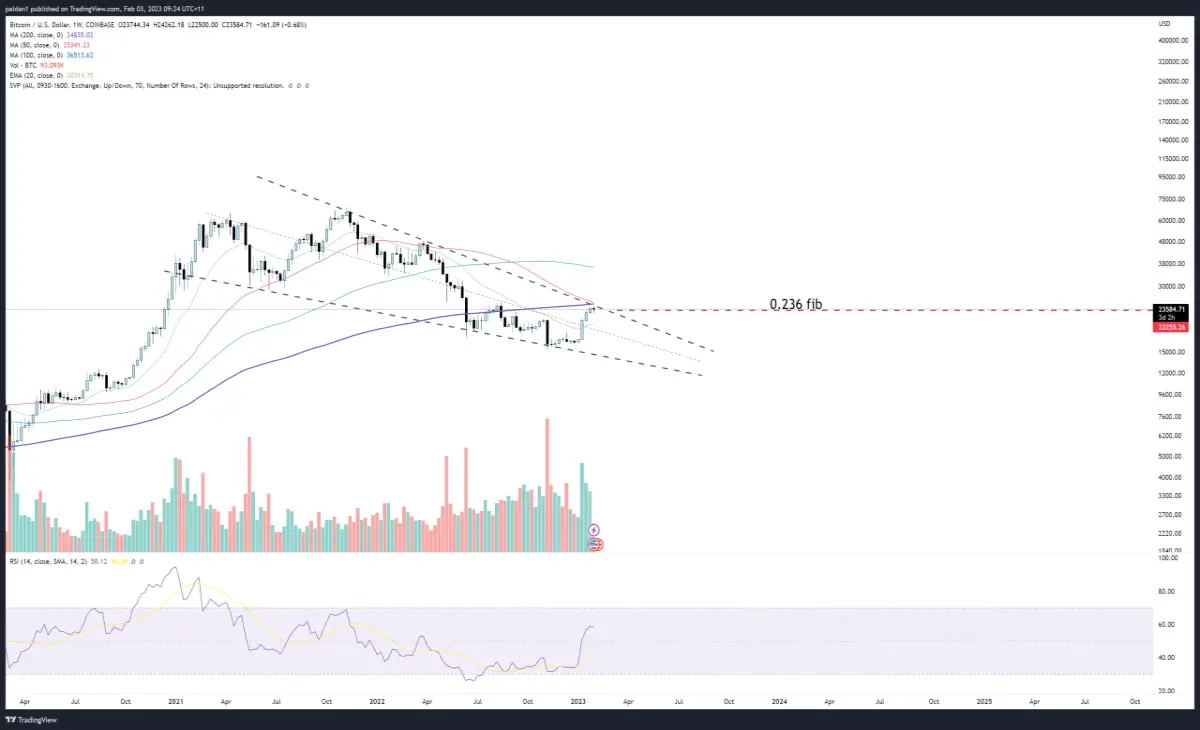
So, what does all this mean for Bitcoin's future? The spinning top and the confluence of resistance indicators, along with the indecision candle, paint a picture of uncertainty in the market. It remains to be seen which way the market will break, but it's important to keep a close eye on these indicators as they can offer valuable insights into future market movements. My guess is a rejection here, and a revisit of the 19k region, and then carry onwards and upwards!






