
The Pepe price surged over 9% in the past 24 hours to trade at $0.000009139 at press time as the meme coin recovers from the recent market crash.
Despite this latest increase, the PEPE price is still in the red on the weekly and monthly time frames. CoinGecko data shows that the meme coin is down more than 22% over the past 7 days and more than 37% in the past month.
Pepe Price Prediction
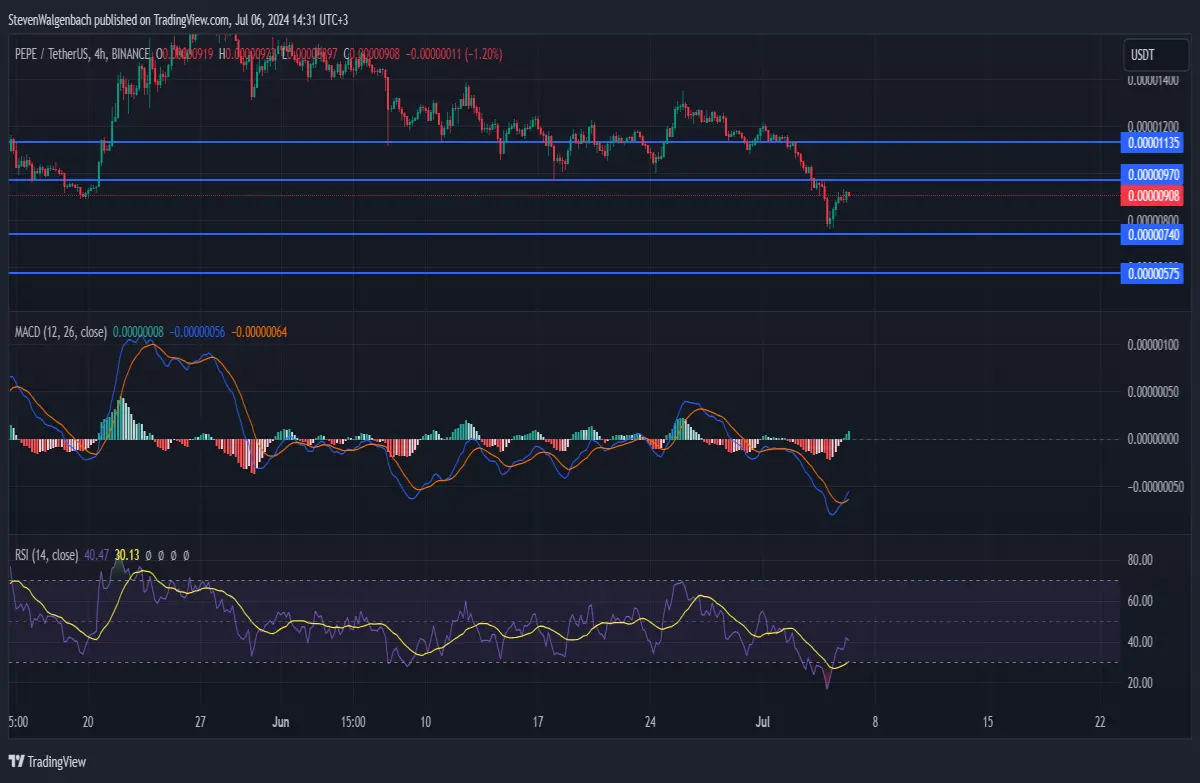
4-hour chart for PEPE/USDT (Source: TradingView)
The Pepe price rebounded from the $0.00000740 support in the last 48 hours, and has been in a positive sequence on the 4-hour chart ever since. As the meme coin approaches the major resistance level at $0.00000970, the crypto’s price has, however, started to level off.
Also read: Bonk Price Prediction: Are You Ready for the Next Big Move?
If PEPE fails to close a 4-hour candle above $0.00000970 within the next 12 hours, then it might enter into a consolidation phase between $0.00000740 and $0.00000970.
However, overcoming the $0.00000970 barrier in the coming 12 hours could give the Pepe price the foundation needed to keep rising in the following 24 hours. Traders might then enter into a long position for the crypto, which could lead to its price rising as high as $0.00001135 in the short term.
On the other hand, PEPE falling below the $0.00000740 support could lead to the bullish and consolidation scenarios not playing out. Instead, the Pepe price might drop to the next critical mark at $0.00000575.
Also read: Bitcoin Price Alert: Crucial Indicators You Need to Know
Bullish Technical Signs Suggest a Continued Climb
Technical indicators on PEPE’s 4-hour chart suggest the meme coin’s price could keep climbing in the coming 24-48 hours. Both the Moving Average Convergence Divergence (MACD) and the Relative Strength Index (RSI) are showing positive signs.
That’s after the MACD line crossed above the MACD Signal line throughout the past day of trading. Traders usually see this as a sign that a crypto has entered a positive short-term cycle. Meanwhile, the RSI also rose above its Simple Moving Average (SMA) line in the past 24 hours to signal that buyers have gained an upper hand against sellers.
Should these technical flags be validated, the PEPE price could soon attempt to flip the $0.00000970 resistance level into support.
Disclaimer: The information presented in this article is for informational and educational purposes only. The article does not constitute financial advice or advice of any kind. Ecoinimist is not responsible for any losses incurred as a result of the utilization of content, products, or services mentioned. Readers are advised to exercise caution before taking any action related to the company.





