![When to buy Bitcoin [Complete Guide For Beginners]](https://www.publish0x.com/img/602346.webp?action=resize&ar=1&enc=webp&inv=0&ori=1&st=1&up=1&w=1140&signature=e173a5a24b117d5347863a513952ef9b76527b37499ecd9ed819d9b3c9b91c08)
In this quick article, i will be sharing my technical analysis of major cryptocurrenciesthat are Bitcoin and Ethereum.
Since you guys are interested in crypto, i think this article will be helpful today'sarticle. All the charts in this articleo will be on a four-hour time frame.
I could have used a smaller time frame
but the problem is that if, you read this after three to four days, the analysis might not be relevant.
Hence, i am using a four-hour chart on
all of the in crypto. So, first let's check out Bitcoin.
Bitcoin

As you can see on this chart Bitcoin has
been in a major downtrend since mid-
april but in the past month or so,i it has been in a tight price ranger roughlybetween 40$ and 30$ thousands. The price has found resistance three timesa atthe forty thousand level.
Similarly, the thirty thousand level has
provided support for three times as well
right now the price is trading around
the forty thousand level.
Hence, this level could provide resistance to the price and we could see bitcoin hit thirty thousand level again.
On the other hand, if the price breaks above the resistance level and gives a strong close we should looka at buying, if the price breaks the forty thousand level the target will be at fifty thousand level.
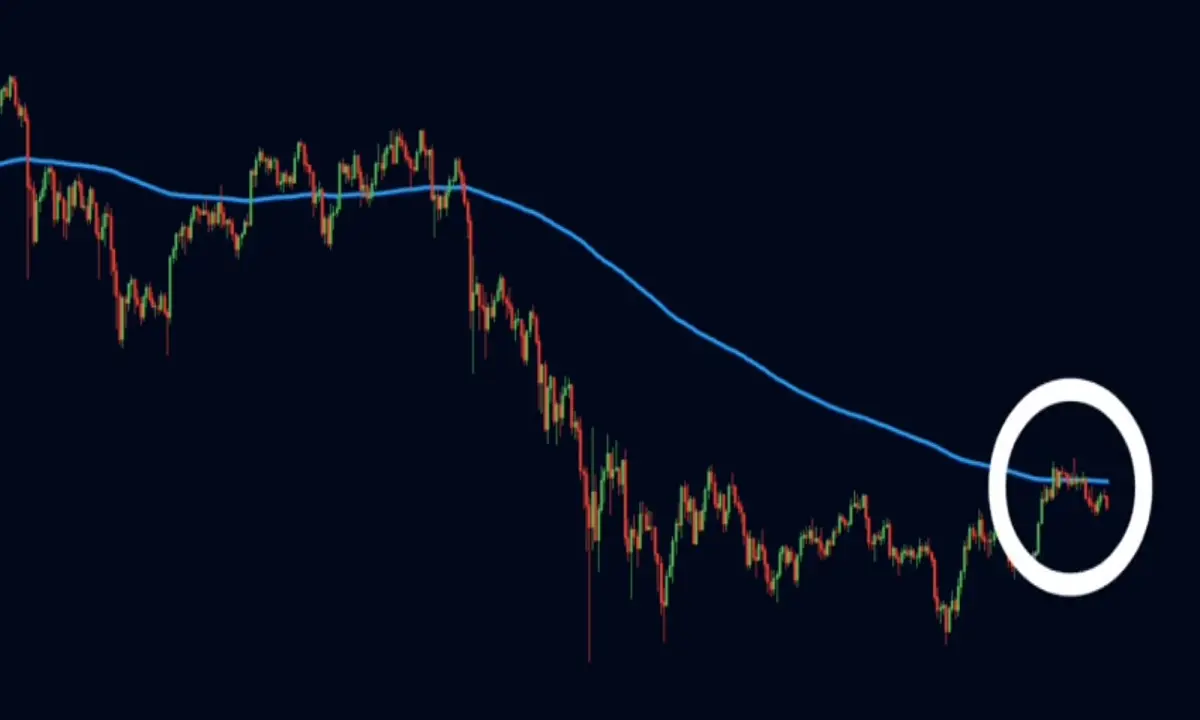
Now let's plot a 200 period EMA on the
chart as you can see the price is trading
below the 200 EMA. So, we are still in a downtrend according to the EMA. The price is currently trading around theEMA.
So, the resistance level combined with
the 200 period EMA is giving us a strong indication that the price might fall a selling opportunity may occur when the
price breaks this short-term trend line.
So, we could sell at the break of this trend line and our target will be at the 30 000 level.
ETHEREUM
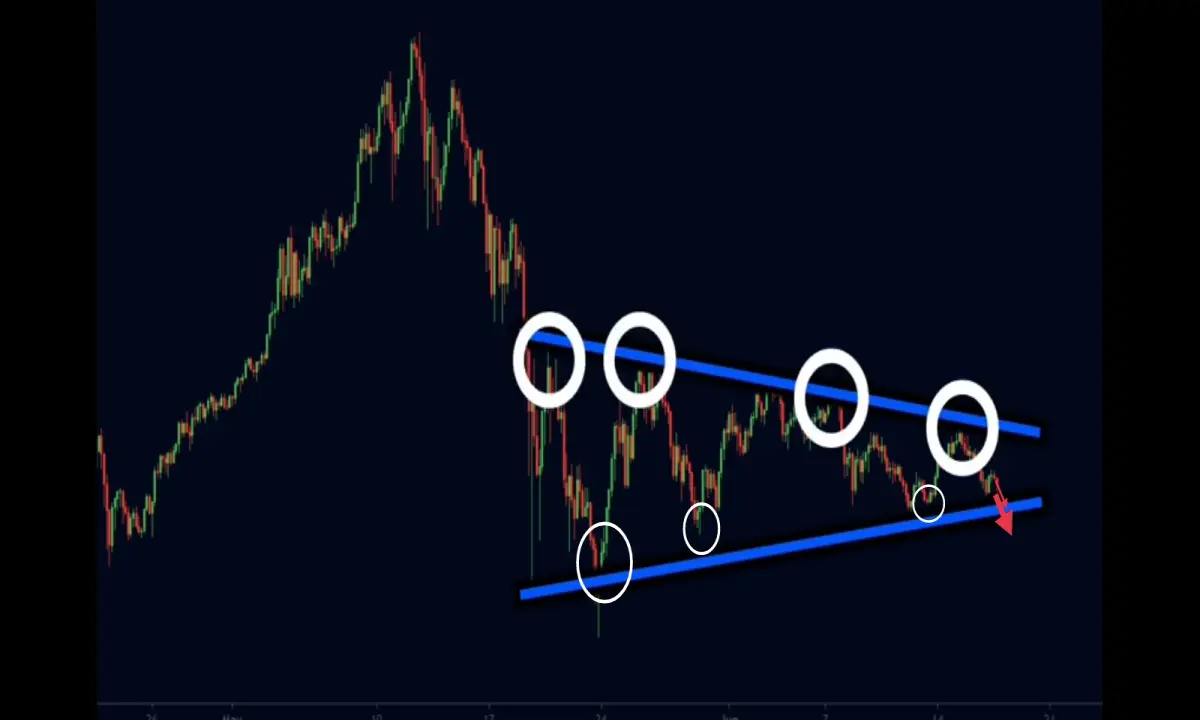
Now let's take a look at ethereum in the past month or so we have seen
ethereum drop from the highs of 4,400$ to the lows of 1,800$, that is a 50 percent fall after the massive fall.
The price found support and created this flag pattern. The upper boundary of the flag has provided resistance four times.
Similarly the lower boundary has
provided support three times currently the price is trading at 2,400$ and it is bound to break out of the pattern.
The breakout could happen in any direction.
If the price breaks above the trend line
we could see the price go back to the
all-time highs of 4,400$.
On the other hand, if the price breaks
below the trend line. The price could easily test the 1600$ level.
I personally believe that the breakout
will happen on the upside but anything can happen.
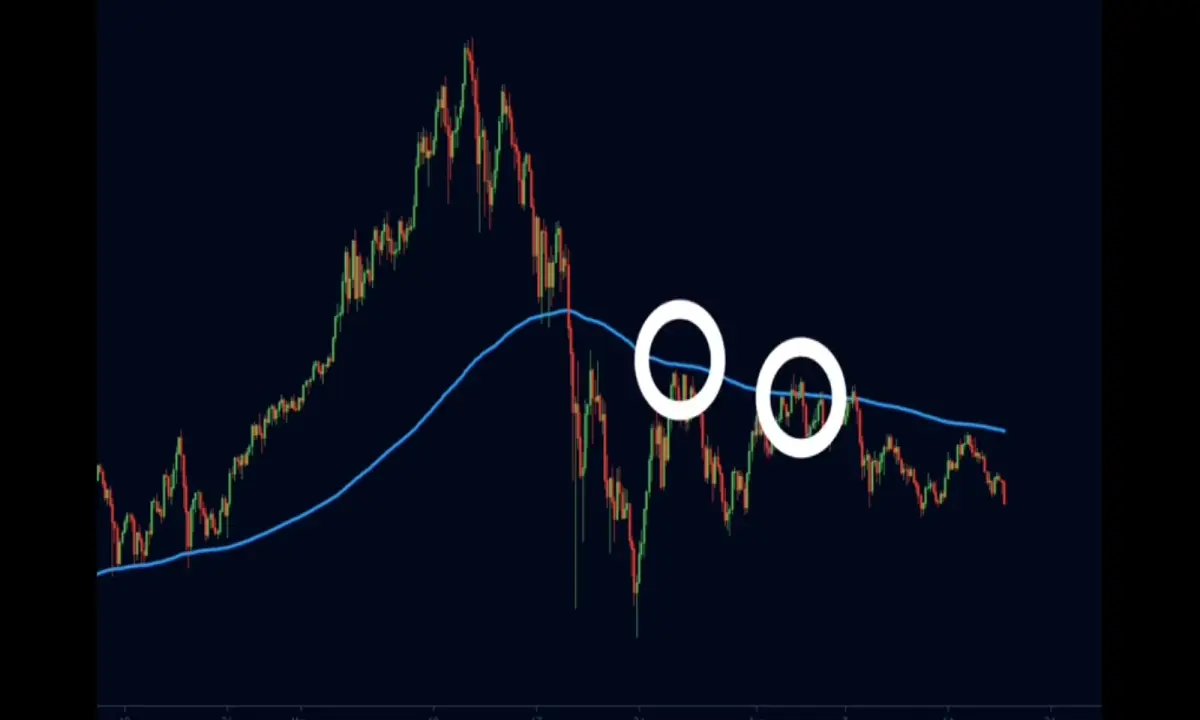
So, you should keep an eye on ethereum. If, we plot a 200p period EMA on the same chart. we can see that the price is trading below the EMA.
We can also see that the price has
previously found resistance at the 200
ema and right now the price is trading near the EMA.
So the price could again find resistance
at the ema and move downwards.
that brings us to the end this article.
Follow Me to never miss out -
Massive Opportunity !
Check out this one When to buy crypto.
Thanks.






