
We may be setting up for a rather large move up in bitcoin.
If history is any indicator, bitcoin may be setting up for a rather large move up.
In bull markets, any time bitcoin has experienced 3 (or more) consecutive red weekly candles, bitcoin has gone on a substantial move up afterwards.
We can see some examples here:
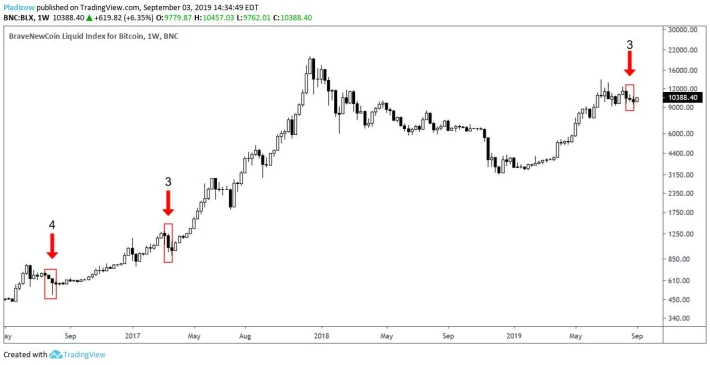
(Source: https://twitter.com/Pladizow/status/1168956210529349634)
Just remember this only holds true in bull markets, so if this isn't a bull market we can throw this pattern out the window.
Also, this chart was mostly only looking at the bull market in 2016-2017, and didn't include all of the examples.
However, what if we zoom out a bit more?
Does this pattern still hold up?
Lets take a look...
Here we have the bull market in 2012-2014 included as well, and we can see that the same pattern plays out again:

(Source: https://www.ccn.com/analyst-spots-trend-suggesting-incoming-monster-bitcoin-rally/)
In conclusion...
Any time we see 3 consecutive red candles on the weekly chart of bitcoin, as long as we are in a bull market, we can expect to see substantial price gains in the coming weeks/months.
We have that exact setup right now.
Stay informed my friends.
-Doc





