Hi everyone,
Today I would like to discuss the drop we have been experiencing for the last couple of days. Obviously it might not be over yet but I would like to know if you have been buying the dip so far or if you are waiting on the sidelines. Please let me know in the comments and if you are on the sideline, what are your targets before thinking of entering the market again.
When I checked the drop on Bitcoin I noticed something interesting, namely that the On Balance Volume indicator (OBV) on the daily and the weekly chart still look very nice. This indicator tells you what smart money is doing. Smart money is more the professional side of money, so institutions, exchanges, banks, whales, etc. When this indicator stays stable or even moves up, while price goes down, it means that price will sooner rather than later go back towards the trajectory the OBV is following. If the OBV goes down while price moves up or stays the same, it would mean that price will follow down.
Here is a daily chart of Bitcoin :
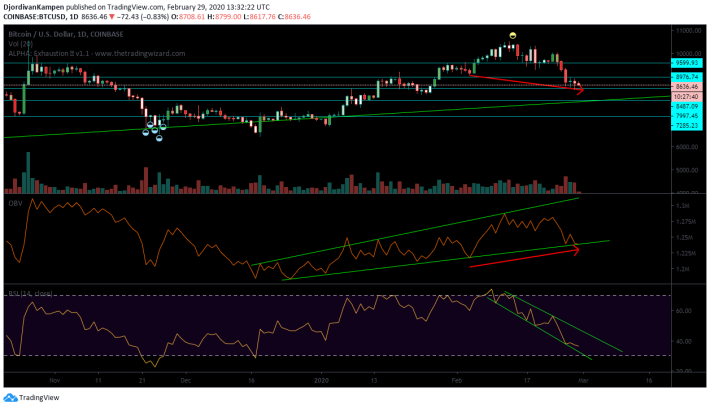
This is BTC on the 29th of February 2020 and on the bottom you have OBV and the RSI (Relative Strength Index). The RSI clearly shows a downtrend and moves within my channel that I drew. The good thing is we are getting closer to oversold conditions and this normally reverses. When you check the OBV I have drawn a channel as well. This channel has been going on for a while now and it clearly shows higher lows and higher highs. I have drawn two red arrows as well to show you something important : OBV is higher in between two price points while price is lower. This should tell you that smart money is accumulating Bitcoin while weak hands get shaken out. Hopefully you are not one of them ! By the way I did not draw it in the chart, but the 200-day EMA (exponential moving average) is holding Bitcoin for the last three days and is currently around 8600$. Furthermore see the green line I drew in the price chart ? This is been holding support for several times already from way before (starting at the 3500$ level). This might well hold again in the next weeks and it coincides with the 0,618 fib retracement level at around 8K.
For me this means I can keep on buying the dips for now and I have been using this opportunity. The OBV channel can break down, but this would not mean all that much, until it actually breaks the last higher low it made (the point of start of the red arrow at the bottom). It can easily break the channel, but end up around the same level as the last higher low. Price in that case would be around 8300/8000 I imagine. The fib level 0,618 (which is a powerful level for Bitcoin) is around the area 8000$ so I would not be surprised if we get a flash down to this level to test it. I will definitely be buying if it gets there.
Here is a weekly chart of Bitcoin :
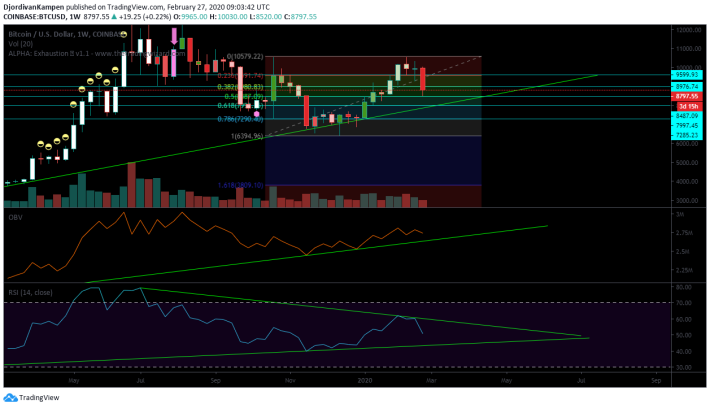
OBV topped out at the 14K level of Bitcoin, but shows that the 6400$ level was the bottom. Since then it has been grinding upwards which is a good sign. What interest me the most is that OBV this week is only very slightly lower than its last low point. When you compare price between these two points it is very clear to see that price is much lower (big red candle this week). This clearly shows accumulation for me and the “shaking out” process is well under way. The RSI has created a lower high since 14K which coincides with price, so nothing special here. We have a lot of room on both sides, so do not be surprised to see RSI grinding downwards towards the green line, while price will stay relatively the same, but lets say in between 8K and 9.2K. This would be a perfect way of creating a bottom and bounce from this green channel towards the upside again and break out of it, but that is still far away.
One more interesting thing to notice, is that price can move towards 7700$, but it should not move lower than that. Here is the logarithmic curve of Bitcoin over time :
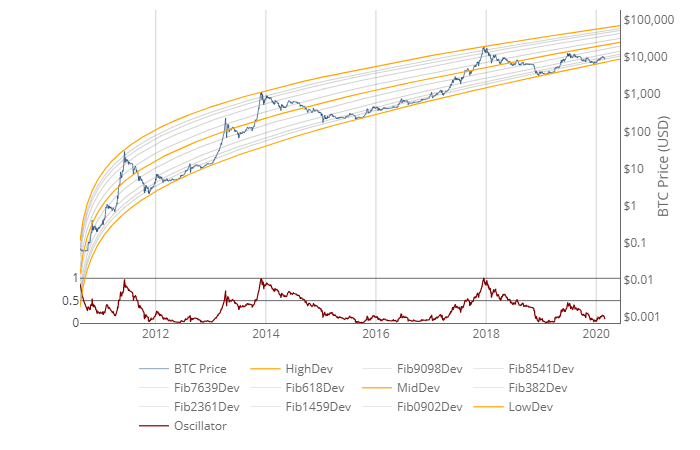
Here you see BTC over time and this curve shows how well Bitcoin respects this curve. We can clearly see the tops and bottoms. The middle line is very important as well, you can see that BTC got rejected there (this was the 14K top in 2019 !). We went to the bottom at 6.4K and right now it seems as we want to visit the bottom once again, which would be 7700$ at the moment. The oscillator at the bottom shows a low point as well and means we have a lot of room for future growth, which could well coincide with after the halvening in May 2020. Follow the price of BTC closely and 7700 might well be the real bottom for Bitcoin to come in the next weeks. If it falls below this, then it would be the first time in history and it would be a little bit scary….
Altcoins at the moment mostly follow Bitcoin (besided Chainlink that is still showing a lot of power and some other exceptions). What I like is that Altcoins are holding up strongly these last two days and Bitcoin tries to be resilient as well, while stock markets, oil and even gold has been going down.
For now I am still buying the dips and the daily and the weekly chart of Bitcoin show me I can keep on doing this. Accumulation is going on and weak hands are being shaken out. It seems scary at the moment with the coronavirus, but I really believe this is a narrative that is being created by the media and the smart money to shake out a lot of retail and this would be their best chance of doing so before the halvening of Bitcoin. I am still accumulating several Altcoins and buying dips as well. I sprinkle my buys in all kind of levels and some of them have been hit already and some of them are not hit yet and may never be hit, but I am ok with that. Keep an eye on Bitcoin and the area of 7700$ and 8300$. This should be the area where BTC can bottom and would be a perfect starting point to look bac up again. Once again we would be creating a higher low on the high timeframes which is very important for the long term success of this bull market.
I am not a financial adviser and this is not financial advice. Please do your own research and make your own decisions. Thank you for reading and until next time !


