Hi everyone,
It has been a while since I posted an article about Bitcoin and cryptocurrencies, because of the weird times we live in right now and because I work full-time (it is now part-time due to the coronavirus and restrictions in France).
Here I am going to show you some weekly charts of Bitcoin and why I think we are still in a very good position for some great gains in the future ! You can always scroll down towards the end to see the levels I am watching and my conclusion (this is my opinion and might well be wrong of course !)
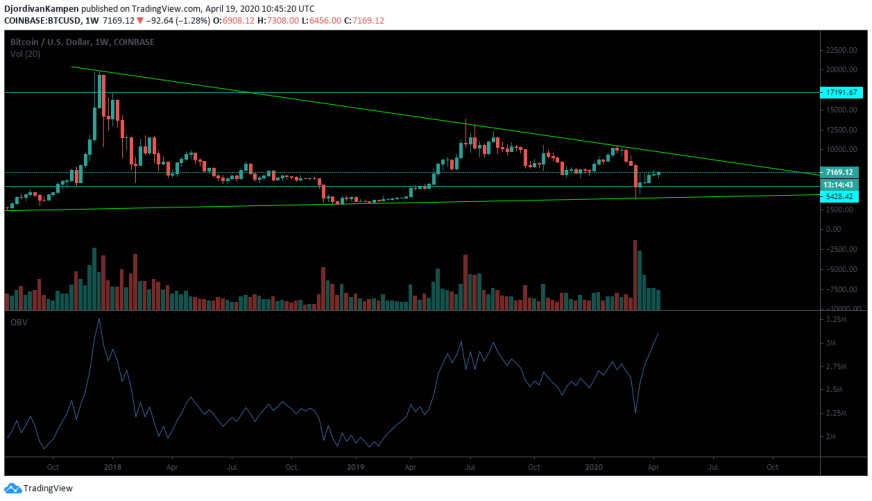
This is a Bitcoin weekly chart with the indicator OBV (On Balance Volume). I have also drawn some lines (green lines are a big channel we are in since the end of 2017 and the blue lines are lines I am watching for longer term).
The indicator OBV is one of my favorite indicators. It is a momentum indicator that uses volume and its changes to predict the price. Volume proceeds price and OBV will show you a bullish or a bearish outcome. Obviously this indicator does not work 100% of the time (no indicator does !), but it can help a lot. On this chart you can see something interesting. The OBV is very high and is even higher than when price was at 13.8K ! Right now we are around 7.1K and OBV is at levels of 13.8K ! This is bullish to me and shows that a lot of weak hands have been shaken out already with the big drop we had. By the way I think the drop to 3.8K was not supposed to happen. It went further down than expected, due to some problems with BitMex and they even had to shut down to stop Bitcoin from dropping further. Right after they came back up price went upwards very quickly and we are now close back to the levels before the big drop came.
What is interesting to notice as well is the fear and greed index. We are currently sitting at 16 which is extreme fear, while price is closing in on levels before the big drop. This is bullish as well, because it means a lot of retail is still very much in fear and not buying, while prices are creeping back up to the same level as when the fear and greed index was at 30/40.
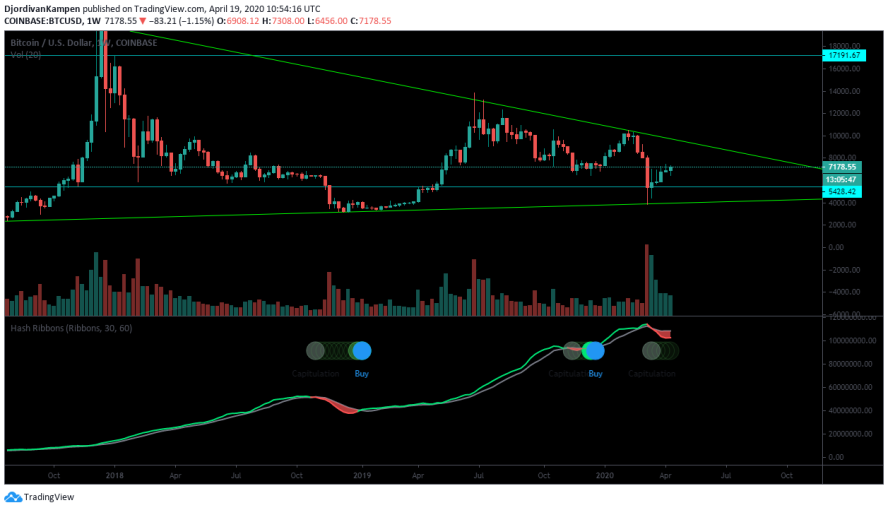
Here is a weekly chart of BTC with the indicator called Hash Ribbons. The grey circle means capitulation and the blue circle at the end is the BUY signal. In this image you can see two examples, but you can always look further back and check for yourself to see that this indicator works pretty well. Right now we have seen capitulation with the big drop and we are forming a BUY signal. It is not there yet so things can change of course, but it does look promising ! You can see on the left we had a BUY signal around the 3.5K level that went all the way towards 13.8K and the one in the middle showed from around 7.5K towards the 10.5K level. This indicator shows you when to buy, not when to sell, so you have to use other indicators (divergences on RSI for example) to see when it is a good time to leave. By the way, you can always take partial profits during the ride. It will never harm you to take out some profits !
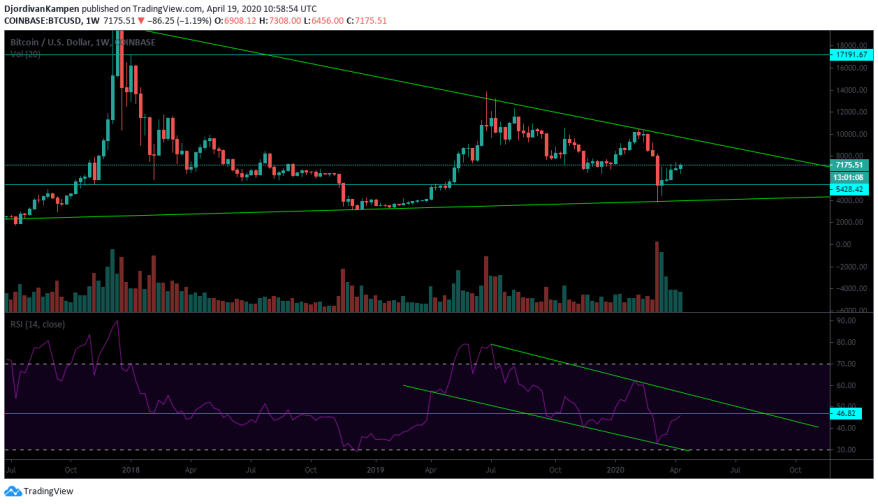
This is a weekly chart of BTC with the RSI (Relative Strenght Index). It seems to be respecting the channel I drew on it (green lines) and we are rising up towards the upper part of the channel. Since we are in a downwards slope it has a decent chance to break above it. It will certainly have quite some room to move further upwards if this was to happen. I am watching the blue line also that shows a pretty important support and resistance level in the RSI. We are very close to it, so it might well be that we get rejected first and move back down.
The levels I am watching for BTC are the following :
- 9500 $. This would be the resistance level where the green line will be at the end of April. This is also an area with a lot of action (resistance and support). This level seems unlikely for me to reach before the halvening though.
- 8000 $. This is an important level for BTC and I see a possibility of reaching this level before the halvening. I hear analysts talk of 9K and 8.5K, but I feel the 8K level is going to be more important for now.
- 7500 $. This is a level that would create a higher high on lower time frames and would indicate a medium term change in trend, which could lead us towards the 8K region. 7.5K is an interesting area to watch since we are getting close to it once again. If we were to go above it, it will be very important to close above this on the daily and not just on a 4-hour chart.
- 6800 $. Watch this area closely, because if we fall again under this level, I feel we will fall down further this time towards the lower 6K region.
- 6000/5500 $ This is for me one of the most important areas to watch for. It is a rather large area, but the 200-week moving average is around this area (around 5600 $ right now, but it moves up every week if we stay above this MA). Bitcoin respects this line a lot and if we were to fall below it and stay there for two weeks, we might be in for a longer term bear market.
For now I think it is best to watch the 7.5K level and the 6.8K level. If we were to fall all the way down to the green line on the weekly chart of BTC, we would go to 4K (this would be next week). This is possible of course, but if this happens I think it will be short-lived and we will see some buying pressure again to move it back right to the 200-week moving average. Falling below the 6.8K level gives room to move towards 6.4K and further down to the 6K region. If the stock markets fall hard next week, we might see a dump on BTC towards the 6K/5.5K area. This would be a sort of second big dump to test and see that we are ready to stay above 6K for the rest of Bitcoins lifetime !
All in all it is interesting to see BTC at these levels this close to the halvening. We hear a lot less noise surrounding the halvening lately and it seems very unlikely to reach 10K, 13K or 20K before we go into it. I have a hunch as well that we are going to see another dump after the halvening so that the media can create a narrative that the halvening was a failure ! This narrative could play out if we are going into the halvening with a price level of around 8K-7.5K and would dump towards the 6K level. This would lead to another accumulation phase before we slowly grind upwards. Oh yeah in the meantime do not forget to buy BTC every now and then now that we have levels of 7K and 6K and maybe even lower ! It is always good to dollar cost average in and HODL. If the narrative of failure gets created, a lot of retail will definitely not buy in BTC anymore. Once we move (this could take a little while) back towards 10K and above, this retail will open its ears again !
This is not financial advice and I am not a financial advisor. Do our own research and make your own decisions.


