Bitcoin (BTC)
This is a weekly chart of Bitcoin with the indicator OBV (On Balance Volume) :
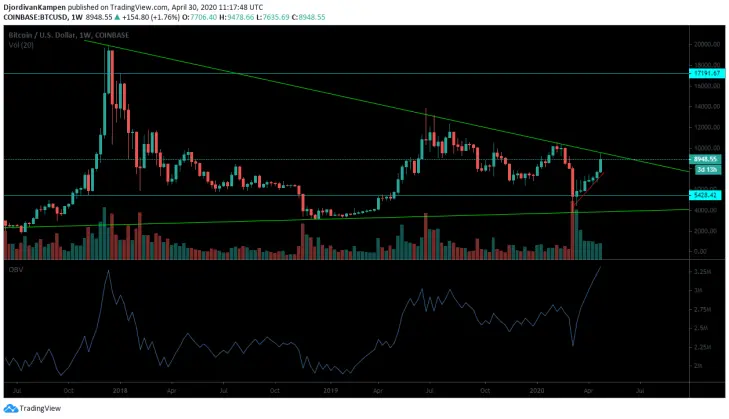
I have drawn a channel (green lines) and at the bottom you have the On Balance Volume which shows smart money. The green channel is very important and has shown since the end of 2017 its worth when we got the top at around 20K. The bottom after that was around 3200 $ and the green line supported it. A very decent move is followed towards 14K and once again the channel holds and we get rejected pretty hard. The big drop we had recently gave us an exact touch to the bottom again and what do we see right now today ? A perfect touch to the top of this channel and for now a rejection (for now still pretty hard again, but we need a weekly close to see where it ends) ! It shows how important this channel is and that the rejection itself is not necessarily a bad thing. We are likely going to need several stabs at it before we can break above it.
When we look at the indicator OBV we see something extraordinary. The line is very high after the big dump and shows that we are at more or less same levels as when we were at a price level of 20K ! Volume often precedes price and shows that we have a decent chance of breaking out towards the upside above the channel ! This would be extremely bullish and might give the rocket ship a chance for take off ! This is a weekly chart so we might stay inside this channel for another couple of months, but it seems destined to break above the channel looking at OBV.
Here is another weekly chart with the indicator Hash ribbons :
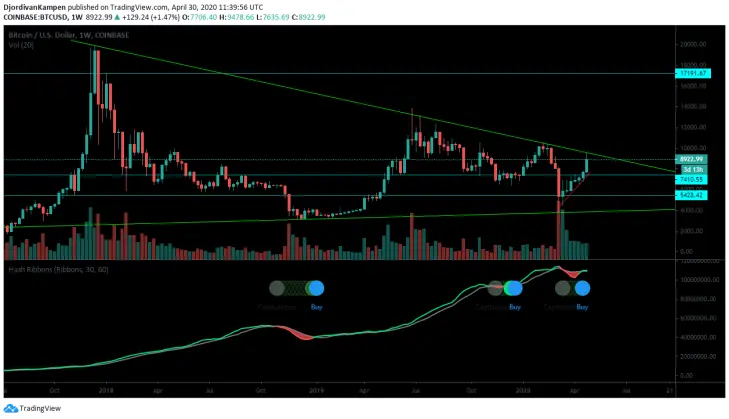
The hash ribbon indicator shows a development of the hash rate of Bitcoin. You can see on this chart (there are more positive examples before 2018 but thy are not on this chart) several symbols with the indicator. The grey circle means capitulation in hash rate. The green circles are kind of recovering circles and the clear blue circle means a “Buy” signal. The first example shows a buy around the 3500 $ area and we went to 14K. The second example shows around 7500$ and it went towards 10.5K.
Since last week we have another buy signal which was around the 7500 $ again ! Right now we see price exploding and it seems this signal has once again worked. However when this signal flashes to a “buy”, it can still move lower, before we see a real uptrend. BTC went up nicely, but today it seems to be hesitant, so we might go back down first before we see a real trend upwards. Bitcoin has likely good support levels around the 8000 $ level, the 7500 $ level and the 6400 $ level. Since we had our move above the 8000 $ level, it seems unlikely for me to be ever going under 6000 $ again. To the upside we first have to cross the 9400/9500 $ area which will be tough and after that the big number is going to be the 10.500 $ level. If we break above that one I will be very bullish and I believe we will see 14K again and likely higher !
All of this does not mean we will just go to the upside. We might well have another correction ahead of us, but that seems to be the last one before moving towards the upside and break the green channel. I have a hunch that after the halvening we will see a dump, but a lot of analysts expect this, so we might not even get it. I would like to see a narrative in the media that the halvening is a failure. This would give a big scare to a lot of people and this could be the last shake out before Bitcoin will really go upwards once and for all. The rocket ship will then be ready for the launch !






