

Therefore, it is very important to know the tools you need well; Two useful tools in technical analysis are resistance and support levels, which are widely used by traders. Investors can recognize the level of support and resistance of the volume of buying or selling in a certain range and use them to make better deals.
What are resistance and support levels in technical analysis?
A trader has a specific goal for doing his trades; Buying an asset at a low price and selling it at a higher price. One of the most basic and understandable strategies that can help achieve this goal is to identify the level of support and resistance of a cryptocurrency. Once traders can recognize these levels, they can adjust their entry and exit times. It is useful to recognize support and resistance in markets with an uptrend, a downtrend, and even a neutral trend.
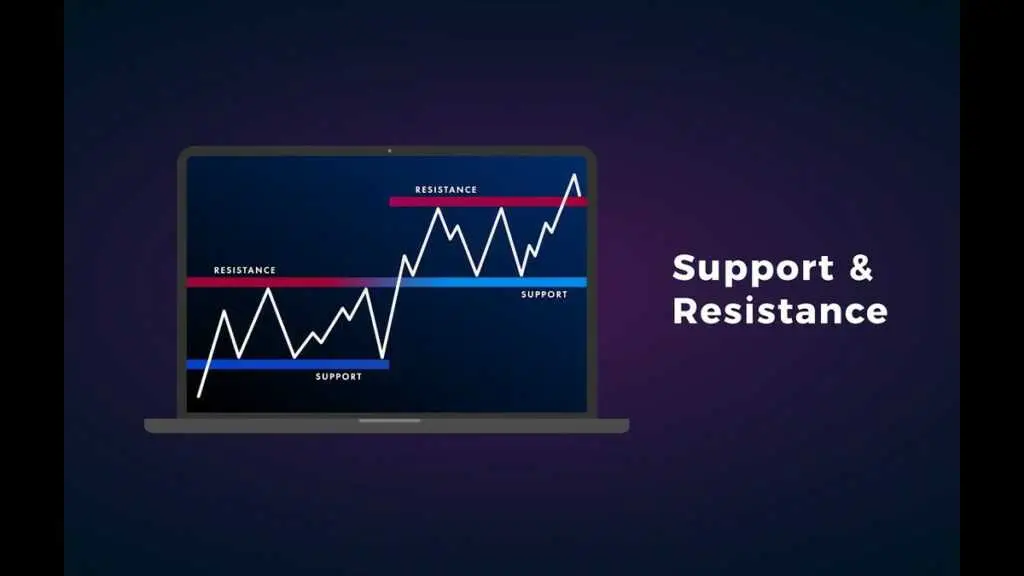
Supports are levels where there is a lot of buying volume. Price barely breaks through these zones (or barely breaks through them) and usually turns back when it hits them. This makes the support points to be considered as a good entry point. If the support area is broken, the price will fall further.
Resistances, in contrast to supports, are levels where the volume of sales is high. Since the selling pressure is high in these areas, it is difficult for the price to break them and if these levels are broken, we will see a significant price increase.
Of course, when we talk about support and resistance areas, we should know that these price levels are not exact and have a few percentage differences. It is also not uncommon for the price to break through support or resistance for a short period of time and then bounce back (this is called a "Retrace").
There is a general rule of thumb in technical analysis, which says to buy at support levels and sell at resistance points. But since these areas may be broken, it is necessary to correctly determine their strength. The strength or power of these areas can be recognized by the volume of buying and selling concentrated in them; The more these volumes are, the stronger the area is. Another way to recognize this issue is to follow the behavior of the price in dealing with these ranges; If the price hits these levels several times and returns, it has more strength.
Using resistance and support levels (just like most indicators) is more reliable on higher time frames.
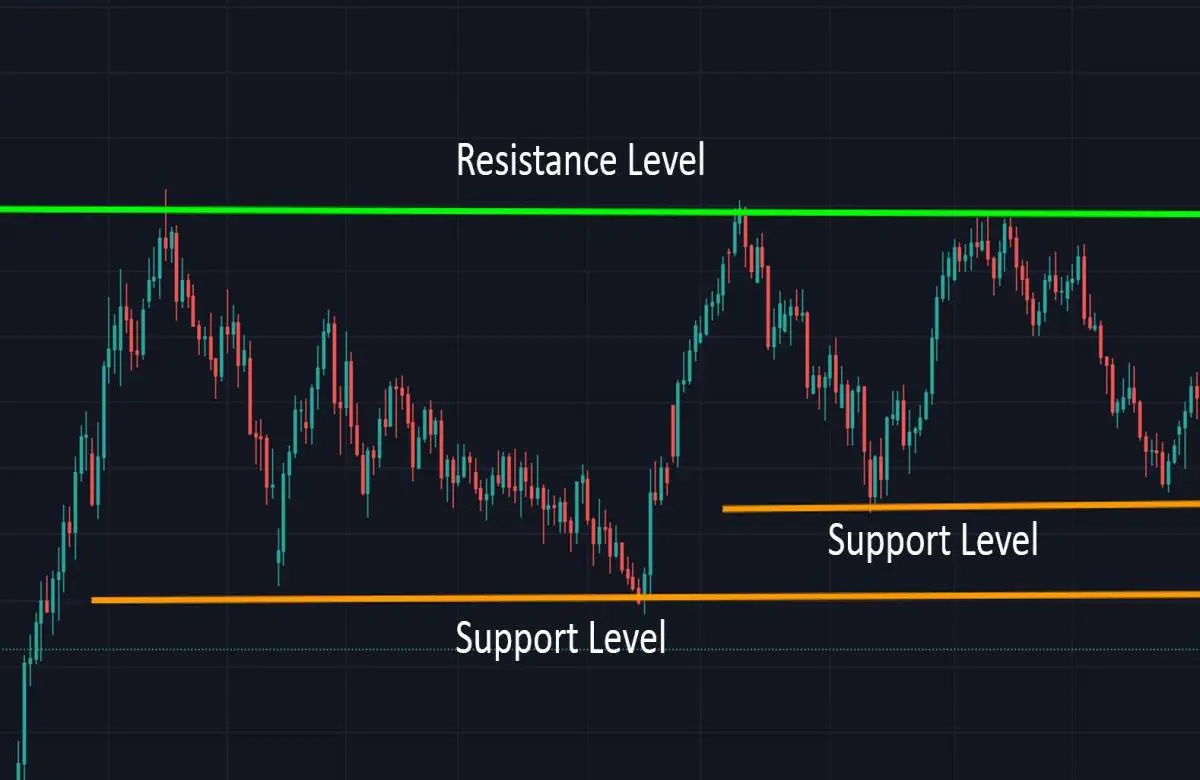
Support levels are areas of price where buy orders are high.
Resistance levels are areas of price where sell orders are higher.
A support level predicts a level below which the price will not decline further.
A resistance level predicts a level beyond which the price will not rise further.
A reversal of resistance/support points (S/R Flip) means that support breaks and turns into resistance and vice versa. If the price has flipped in the same range several times, it is considered an important range on the chart.
These areas can be identified using trendlines, horizontal lines, moving averages, Fibonacci indicators, Ichimoku clouds, etc.
What is the level of support?
As we said, support is formed where the demand to buy a cryptocurrency increases and this increase in demand is greater than the supply pressure of that currency by its sellers. In other words, the power of the people who buy that digital currency is greater than the power of its sellers; As a result, this prevents the price from falling further. At this level, two things happen:
Buyers (bulls) tend to buy at this level; Because they believe that the price is attractive enough and the possibility that the price will be lower than this deal is very low.
On the other hand, sellers close their short positions and exit the market; Because they believe that the market has fallen enough and the price will probably return soon. When both of these situations occur, a support is formed
tanks for reading .






