BTC actual status and S2F

By Can | Dİfferent Articles | 8 Jun 2020


I haven't seen me for a long time, but this time you should excuse me again. I'm not in the mood for some big charts, I'll share the real weekly chart in the last week with the new Stock stream model.

8723ffa6ea3f315613dfd0b2d33dac0441126b3eb41ad864df121cd610ab54d3.jpeg


The real situation (chart 1).

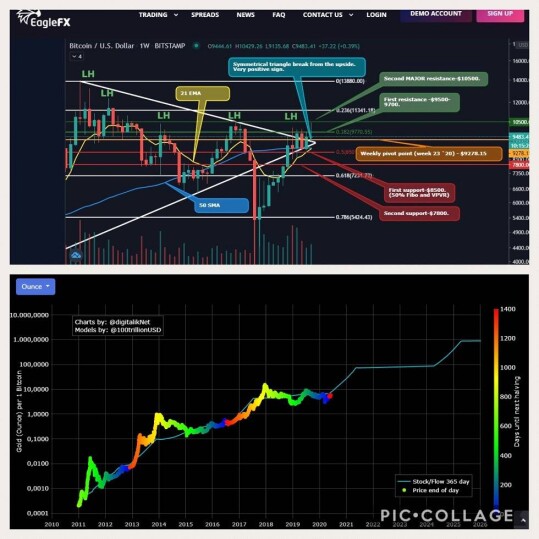
Support and resistance:
Support:
1 st support - $ 8,500 - 50% Fibo and VPVR profile

2 nd support - $ 7800

Resistance:
1 st resistor - $ 9500-9800

2 nd resistor - $ 10500 - As mentioned above, the next ATH will be a BIG resistor on the road, not only for the medium term but also in the long term.


Weekly pivot point is $ 9278.15.
The 50 SMA is below the price for now.
The 21 EMA is below its price for now.
We are very close to the rise between 21EMA and 50SMA, but let's wait for confirmation.
All this week the candle is on the symmetrical triangle. A very positive sign.
In conclusion, I expect something positive next week.
New Stock flow model. (chart 2).
With real money pressure and very likely inflation, and even hyperinflation, the future BTC price could reach $ 100,000, $ 1mil. and more. But what about that $ 100,000 or $ 1 million purchasing power? I think this is a big question. Unlike FIAT, Gold is gold. Regardless, 100 years ago or 100 years later. For this reason, the latest BTC vs Gold Stock model becomes even more important for the flow. Just check the chart.

How do you rate this article?

2


Dİfferent Articles
Dİfferent Articles

I will write different articles

Send a $0.01 microtip in crypto to the author, and earn yourself as you read!

20% to author / 80% to me.
We pay the tips from our rewards pool.