
Introduction
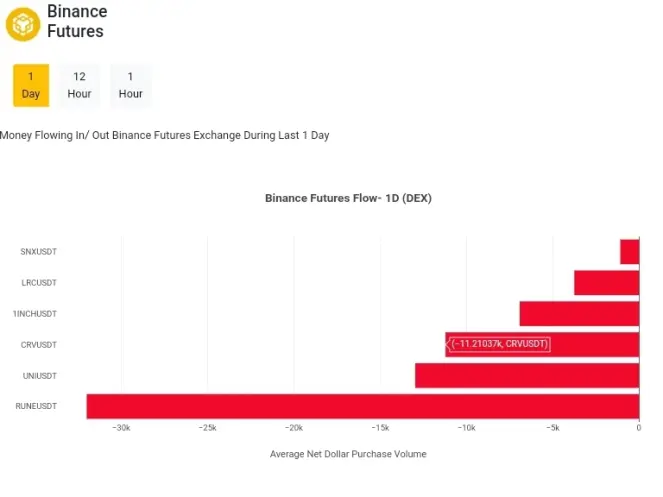
(View the live dashboard at: https://bit.ly/flowlytics)
Just started a new crypto analytics project known as Flowlytics. So what is this project about ? And why I started this project in the first place ?
Mission and Purpose
One of the beauties of Web 3.0 and cryptocurrency in general is its promise of decentralization,where the underlying protocol is less controlled by an entity or an individual, but collectively by token holders.
However, another problem that arises with this is data silo.
Since all DApps are built distinctly on different smart contracts and different blockchains, hence all on-chain data points are not standardized and are organized in a messy way.
Although all on-chain data are publicly available, it's not readily available to the public in a readable state yet.
Flowlytics is created with the aim of collecting and standardizing both on-chain and off-chain data from DApps and crypto exchanges, with the hope of reducing information asymmetry and promoting blockchain data transparency.
Net Dollar Purchase Measurement
Our very first dashboard was developed to track the fund flow in Binance Futures exchange, using a metric known as net dollar purchase. So how is this metric computed ?
In any selected time interval (1 d, 12h, 1h), snapshots of historical buy and sell volumes were taken at a 5-minute interval basis up to the selected time interval.
E.g. 12h would take into consideration 12*60/5= 144 data points with 5 min apart each up to 12 hours ago.
Average net dollar purchase = Average of (Buy Volume - Sell Volume), in dollar terms.
A positive value implies that out of all the samples taken, traders are longing more than shorting on average and vice-versa.
Limitation of Current Measurement and Future Improvement
A limitation of this measure though is that there could be an outlier flash event (e.g. a very large buy/sell event) which may not be captured in our 5 min-interval samples.
Besides, this measure applies the same weight to all historical data points, and the past data may be irrelevant due to sudden market regime change.
While we are working to add on time-weighted feature, you may checkout our existing dashboard here:





