
Investment Disclaimer:
- I am not a registered investment, legal, or tax adviser or a broker/dealer, and all opinions expressed by me are from my research for educational purposes only.
- Past performance presented here is not an indicator of future performance.
- This post expresses my own opinion about the cryptocurrency mentioned herein and is not an offer to buy or sell, or a solicitation of any offer to buy or sell the cryptocurrency mentioned in this post.
Announcement from Quantdoge
If you are actively following my blog- Daily Crypto Risk Report, I sincerely thank you for taking the time to read my analysis, and your support is greatly appreciated. To further improve the quality of my daily analysis, I am actively making constant enhancements here and there.
I am pleased to announce that Quantdoge would be adding the Community Analytics section which you could find below in this article, where this section would look at how the community of particular cryptocurrency fares over time.
In the meanwhile, Quantdoge is working hard on Developer Analytics and On-Chain Analytics features which would be gradually released over this month. Please stay tuned.
1. Top 3 Good News for ETH HODLERS !!!
- CBDC Can Be Set Up on Ethereum Network, Says Architect of Digital Yuan
Statistic as of 2021-05-31 09:15 AM EDT: 30 positive votes, 0 negative vote
Yao Qian, a former director of the PBOC's Digital Currency Research Institute, claims that a central bank digital currency can run on the Ethereum network.
(Extracted from CryptoPanic) -
This Ethereum metric exceeds Bitcoin’s again! Here’s the impact
Statistic as of 2021-05-31 09:15 AM EDT: 27 positive votes, 0 negative vote
Trading below the $2500 level, Ethereum’s rally is faster, post the recovery. What’s interesting is that the Ethereum options volume has surpassed that of Bitcoin few times in a row. Based on data from Skew, options volume dropped consistently since May 24, and is consistently below $500 Million. With several flippening metrics like transaction fees, […]
(Extracted from CryptoPanic) -
‘Ether Beats Bitcoin as a Store of Value,’ Says Goldman Sachs Global Macro Research
Statistic as of 2021-05-31 09:15 AM EDT: 31 positive votes, 5 negative votes
A new research report out of Wall Street banking giant Goldman Sachs predicts Ethereum overtaking Bitcoin as a store of value asset. Santiago Roel Santos, General Partner at blockchain-focused investment firm ParaFi Capital, published a series of tweets showing excerpts from relevant sections of a 41-page report (titled: “Crypto: A New Asset Class?”) by Goldman’s […]
(Extracted from CryptoPanic)
2. How Ethereum Performs Relative to Other Cryptos ?
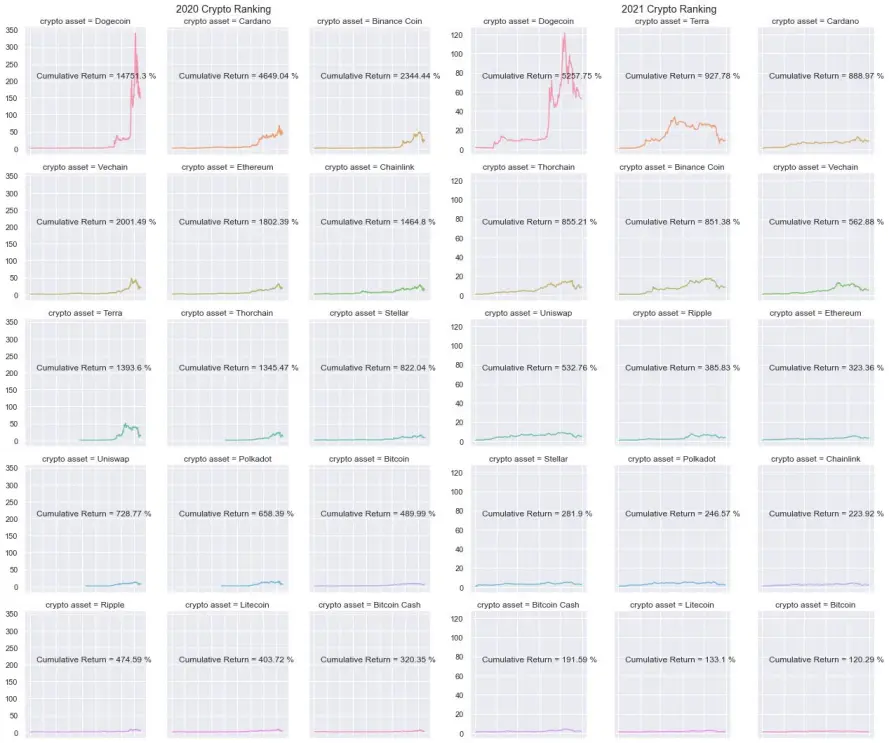
As of 31 May 2021, Ethereum has made a cumulative return of 1802.39% since Jan 2020 and 323.36% since Jan 2021. It is currently the 9th greatest performing crypto asset since Jan 2021 as compared to the other cryptocurrencies presented above.
3. Technical Analysis on Ethereum
3.1. Volume Weighted Average Price (VWAP)
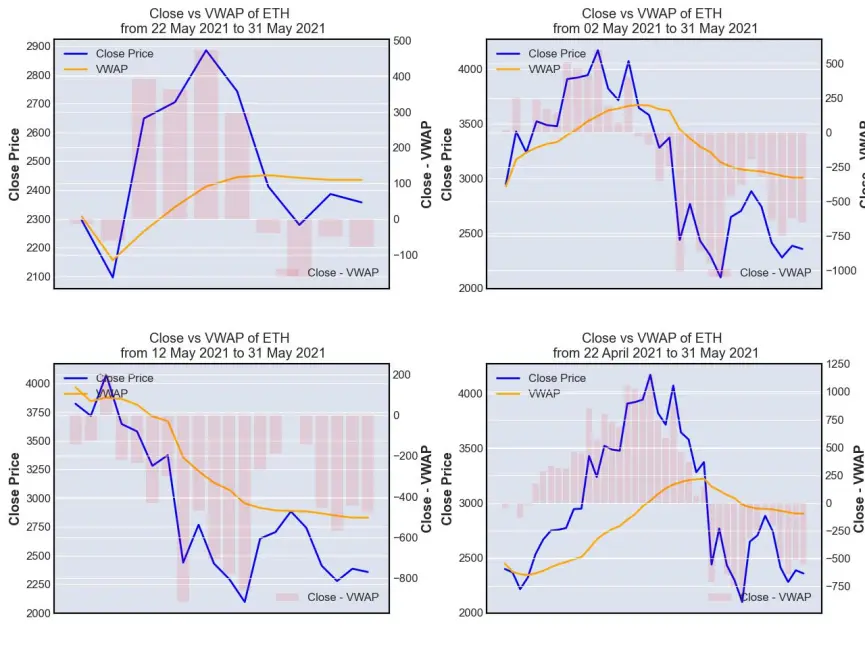
VWAP is a technical indicator used by a trader to gauge the overall trend of an asset price movement. VWAP line (orange line) represents the volume-weighted average price (average price here is defined as the average of high, low and close prices) while close price line (blue line) represents the price when ETH is closed at the end of every single day.
Whenever blue line (close price) is above orange line (VWAP), it indicates that the asset is gaining momentum and being traded higher than its average price level. This would represent a 'buy' opportunity for short-term momentum trader whom task is to trade following the trend while a longer term mean-revision trader might take it as a 'sell' opportunity, anticipating that the price of ETH (blue line) to fall to its average level (orange line).
Whenever blue line (close price) is below orange line (VWAP), it indicates that the asset is losing momentum and being traded lower than its average price level. This would represent a 'sell' opportunity for short-term momentum trader whom task is to trade following the trend while a longer term mean-revision trader might take it as a 'buy' opportunity, anticipating that the price of ETH (blue line) to rise to its average level (orange line).
As of 31 May 2021, VWAP is suggesting that ETH is trading below its average price range of USD 2,750 to USD 3,000 at the time of writing.
3.2. Moving Average Convergence Divergence (MACD)
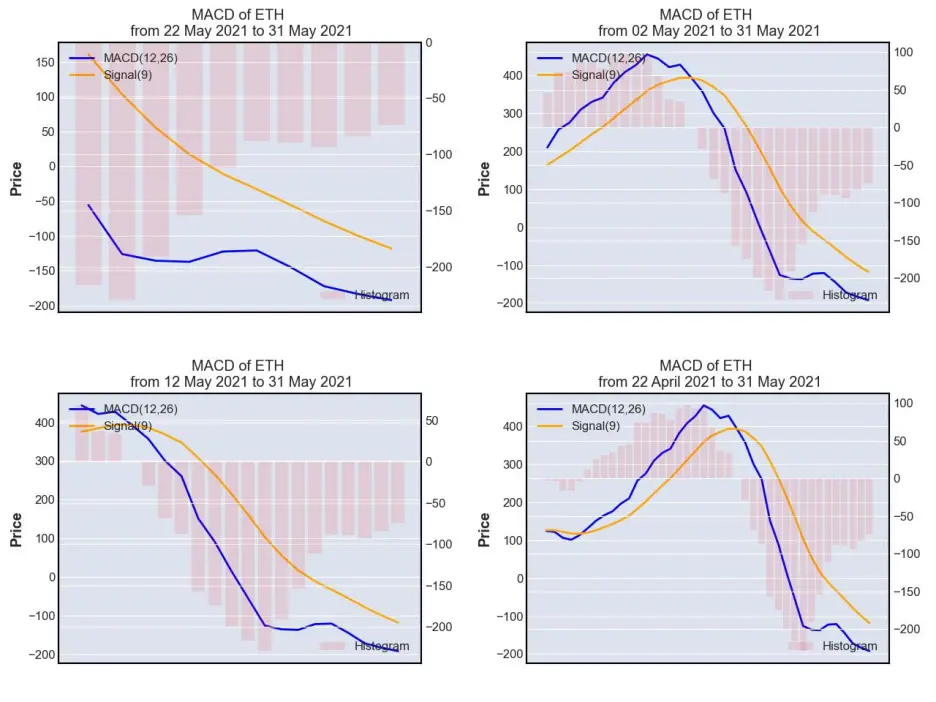
MACD is often used by trader as a momentum indicator. There are 2 lines that form the above charts, namely MACD (12, 26) lines and Signal(9) line, while the histogram is calculated by subtracting Signal (9) from MACD (12,26). Histogram would fall to the negative territory whenever MACD (12, 26) is trending at a lower level than Signal (9) and rise to the positive territory whenever MACD (12,26) is trending at a higher level than Signal (9).
MACD (12, 26) is computed by subtracting the 26-day exponential moving average (EMA) of ETH closing price from its 12-day EMA.
Signal (9) on the other hand is calculated as the 9-day EMA of MACD (12,26).
As MACD (12, 26) goes higher away from Signal (9), it signifies that ETH is gaining momentum and whenever it goes trends at a lower level than Signal (9),it signifies that ETH is losing momentum.
As of 31 May 2021, MACD is suggesting that ETH is losing momentum.
3.3. Bollinger Band
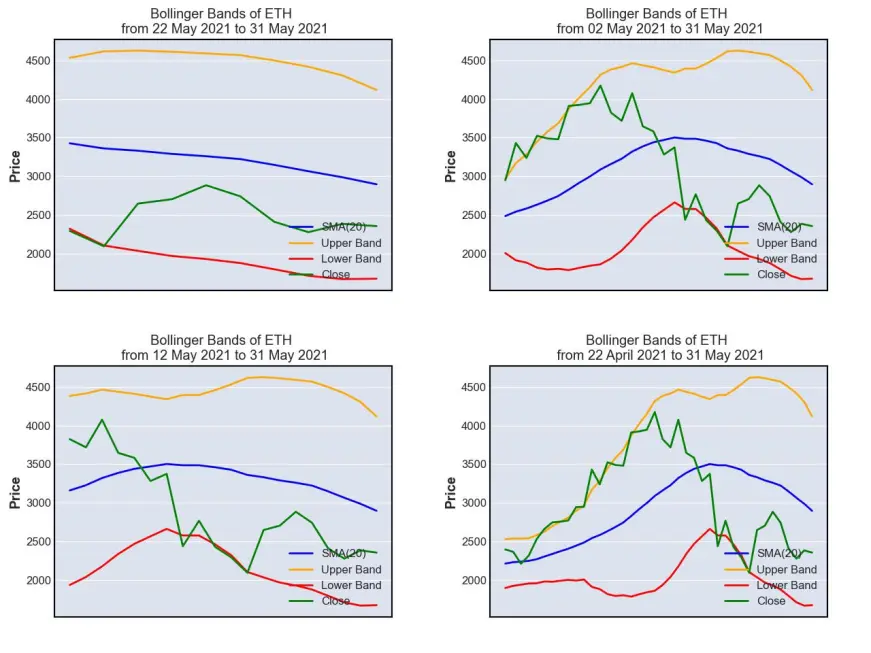
Bollinger band is often being used by mean-reversion trader as a gauge to assess how undervalued or overvalued an asset is. Its chart made up of 4 lines, namely:
- SMA (20) (blue line), which is the 20-day simple moving average price of ETH
- Upper Band (orange line), which is computed by adding 2 standard deviations of ETH on SMA (20)
- Lower Band (red line) , which is computed by subtracting 2 standard deviations of ETH from SMA (20)
- Close (green line), which is the daily closing price of ETH
Whenever close line (green) touches the lower band (red), it indicates that ETH is corrected too much and is being traded at an undervalued level, representing a 'buy' opportunity. On the other hand, whenever close line (green) touches the upper band (orange), it indicates that ETH is gaining too much momentum and is being traded at an overvalued level, thus indicating a 'sell' opportunity.
As of 31 May 2021, Bollinger Band is suggesting that ETH is trading near its oversold level (i.e. undervalued level).
3.4. Relative Strength Index (RSI)
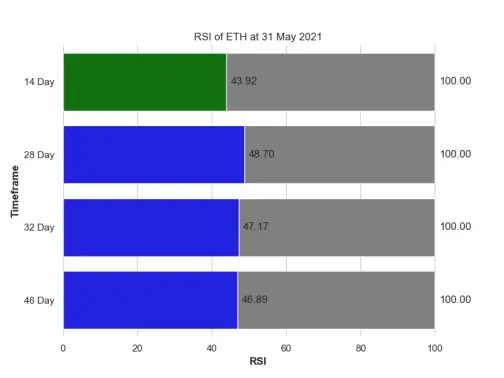
Just like Bollinger Band, Relative Strength Index is often being used by mean-reversion trader as a gauge to assess how undervalued or overvalued an asset is. There are 2 psychological levels, i.e. 30 and 70 in RSI. Whenever the RSI reaches 30, it indicates that ETH is corrected too much and is being traded at an undervalued level, representing a 'buy' opportunity. On the other hand, whenever RSI reaches 70, it indicates that ETH is gaining too much momentum and is being traded at an overvalued level, thus indicating a 'sell' opportunity.
As of 31 May 2021, RSI is suggesting that ETH is trading near its oversold level (i.e. undervalued level) in the 14-day trading window.
Based on the technical analysis presented above, quantdoge is bullish on Ethereum, but I could be wrong, hence please make your careful due diligence before making any financial decision.
4. Ethereum Risk Profile
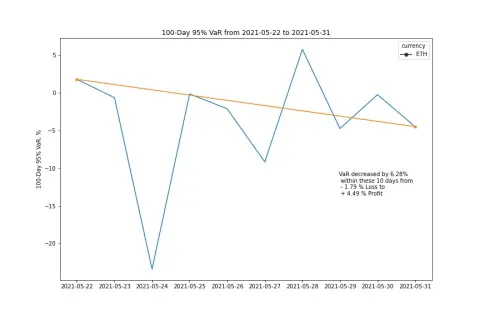
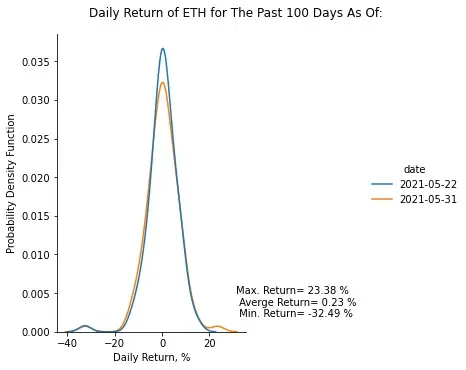
Based on the 100-day 95% historical Value-at-Risk (VaR) profile of Ethereum defined above, ETH seems to trade at a lower risk level on 31 May 2021 as compared to 10 days before on 21 May 2021, with its biggest pullback being seen at -32.49% on a single day during the last 100 days. However, I could be wrong, hence please make your careful due diligence before making any financial decision.
5. Price Simulation for Ethereum
How did quantdoge simulation perform vs the actual ETH price movement over the last week ?
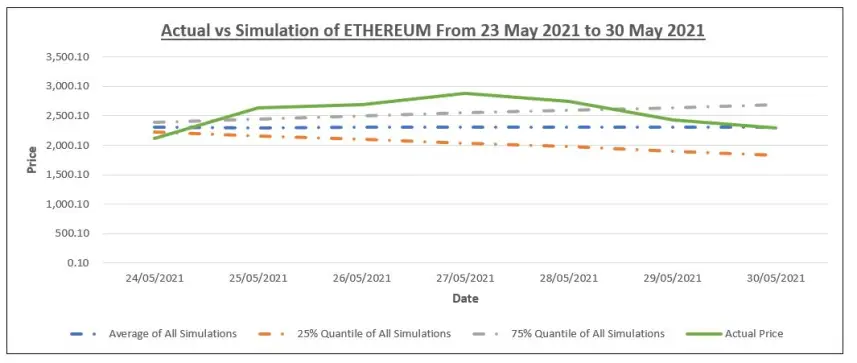
Over the last 7 days, ETH has been trading near the median price range of quantdoge simulations, indicating that ETH was trading at its fair value level over the last week.
6. ETH Community Analytics
Number of ETH Followers In The Past 24 Months
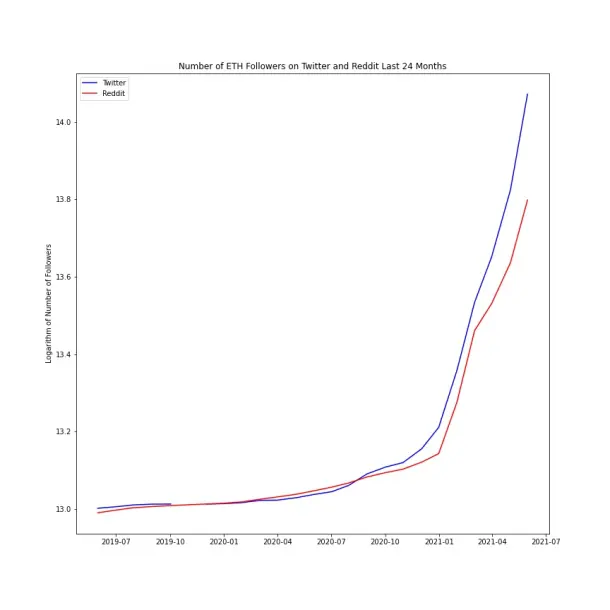
During the past 24 months, Ethereum followers have grown 191.48 % from 443,223.0 to 1,291,917.0 on Twitter and grown 124.39 % from 438,037 to 982,913 on Reddit.
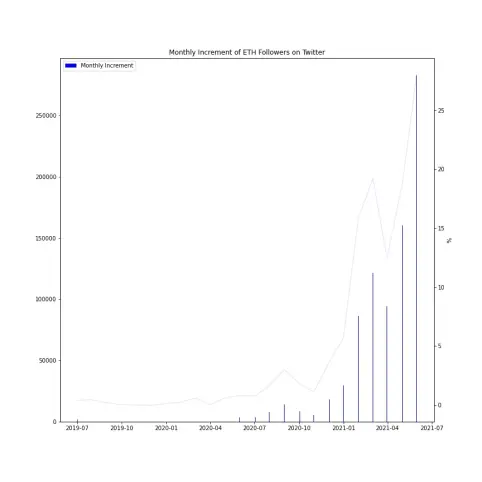
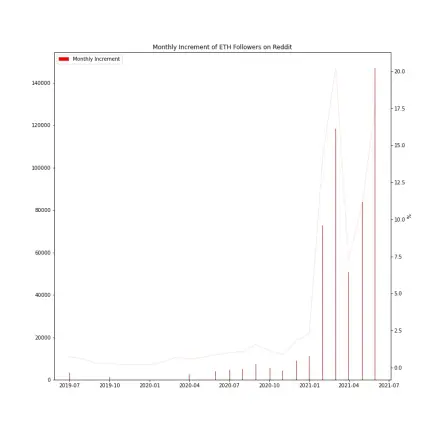
Monthly increment of Ethereum Twitter followers peaked on May 2021 and its monthly increment of Reddit followers peaked on May 2021.
Number of ETH Followers In The Last 30 Days
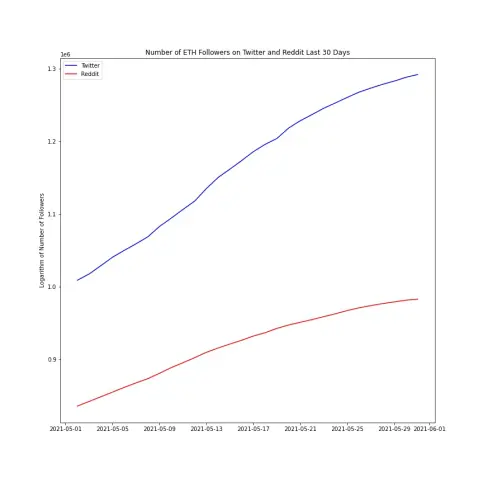
In the last 30 days alone, Ethereum followers have grown 28.05 % from 1,008,910 to 1,291,917 on Twitter and grown 17.6 % from 835,818 to 982,913 on Reddit.
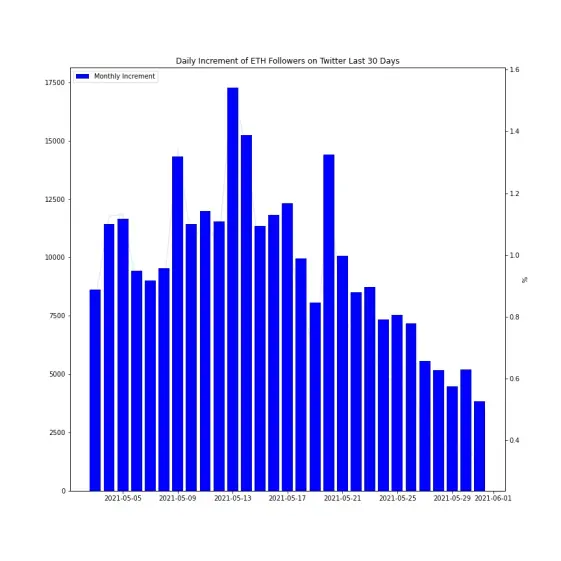
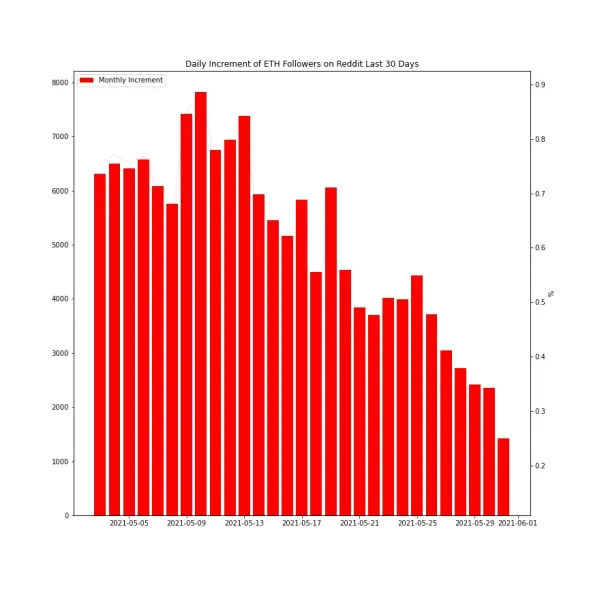
Daily increment of Ethereum Twitter followers peaked on 13 May 2021 and its daily increment of Reddit followers peaked on 10 May 2021.
If you like my analysis and articles, please follow me at @quantdoge for daily updates.






