Investment Disclaimer:
- I am not a registered investment, legal, or tax adviser or a broker/dealer, and all opinions expressed by me are from my research for educational purposes only.
- Past performance presented here is not an indicator of future performance.
- This post expresses my own opinion about the cryptocurrency mentioned herein and is not an offer to buy or sell, or a solicitation of any offer to buy or sell the cryptocurrency mentioned in this post.
- I do hold a long position in LUNA as a token holder.
1A. Top 3 Bad News for LUNA HODLERS !!!
- Terra's LUNA Dumps After Wonderland Controversy
(Extracted from CoinDesk) -
Terra (LUNA) at risk of 50% drop if bearish head-and-shoulders pattern plays out
Statistic as of 2022-01-29 07:04 AM EDT: 3 positive votes, 9 negative votes
LUNA price is at risk of further downside, but analysts point to a possible rebound as the altcoin tests a reliable, multi-month moving average as support.
(Extracted from Crypto Panic) -
Terra (LUNA) Plunges While Crypto Market Remains in Limbo
Statistic as of 2022-01-29 07:04 AM EDT: 0 positive vote, 5 negative votes
Concerns surrounding the sustainability of the Anchor protocol are exerting selling pressure on Terra (LUNA).
(Extracted from Crypto Panic)
1B. Top 3 Good News for LUNA HODLERS !!!
- InvestAnswers Host Gives His Verdict on Terra, Solana, Avalanche, Fantom, Polygon, Polkadot, and Cardano
Statistic as of 2022-01-29 07:04 AM EDT: 11 positive votes, 0 negative vote
(Extracted from Crypto Panic) - Macro Guru Raoul Pal Says Terra (LUNA), Avalanche (AVAX) and Three Additional Altcoins Will Shine in 2022
Statistic as of 2022-01-29 07:04 AM EDT: 11 positive votes, 0 negative vote
Real Vision CEO Raoul Pal says that five altcoins will perform well this year as he expects layer-1 altcoins and interoperable blockchains to shine.
(Extracted from Crypto Panic) - UST: This latest initiative by Terra’s ecosystem is reshaping algorithmic stablecoins
Statistic as of 2022-01-29 07:04 AM EDT: 9 positive votes, 0 negative vote
Decentralized stablecoin issuer Terra issued a proposal to expand the interchain deployment of its TerraUSD (UST) stablecoin. Namely across five projects on Ethereum, Polygon and Solana. Terra would provide over $139 million in UST and LUNA to DeFi projects for at least the next six months.
(Extracted from Crypto Panic)
2. How Terra Performs Relative to Other Cryptos ?
Performance of All Cryptos Under Quantdoge Watchlist since 2021 (Sorted by % Return)
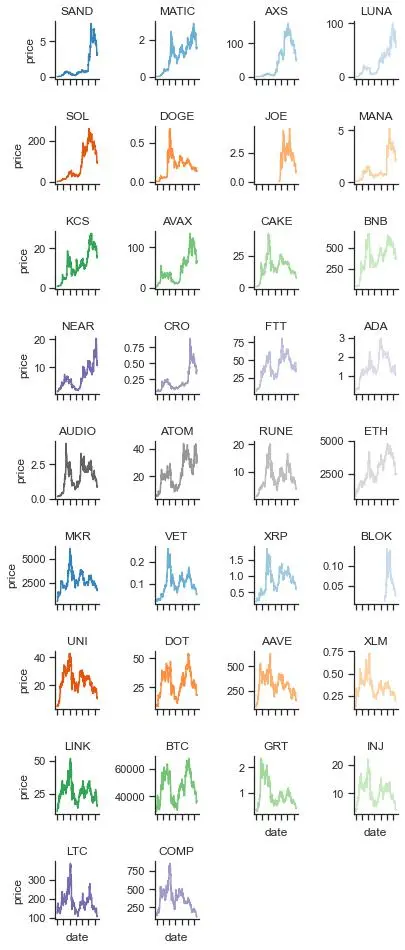
LUNA has undergone 8,224.24% return from USD 0.6518 to USD 54.2574 since 01 Jan 2021. LUNA is the 4th best performing crypto assets among others here.
3. How Resilience Terra Is Towards Bitcoin Crash Relative to Other Cryptos ?
Historically, all altcoins are somewhat dependent on Bitcoin price movement and it’s often the case where if Bitcoin falls, most altcoins would follow.
Top 3 Cryptos That Are Most Resilient To Bitcoin Crash During Each of BTC 4 Largest Crashes in 2021
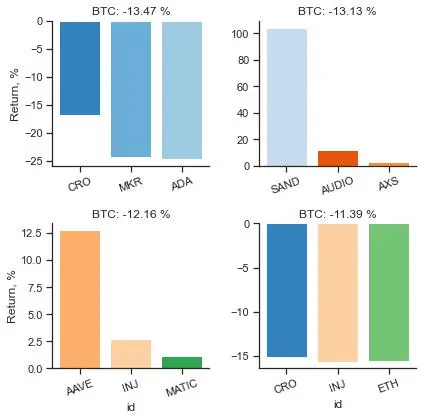
LUNA has proven resilience against BTC crash in 0 out of the 4 instances.
During the last 4 BTC market crashes,
When BTC dropped by -13.47 %, LUNA returned -38.27 % at 20 May 2021,
When BTC dropped by -13.13 %, LUNA returned -12.19 % at 22 January 2021,
When BTC dropped by -12.16 %, LUNA returned -9.28 % at 13 May 2021,
When BTC dropped by -11.39 %, LUNA returned -17.47 % at 22 June 2021
4. Technical Analysis on Terra
4.1. Volume Weighted Average Price (VWAP)
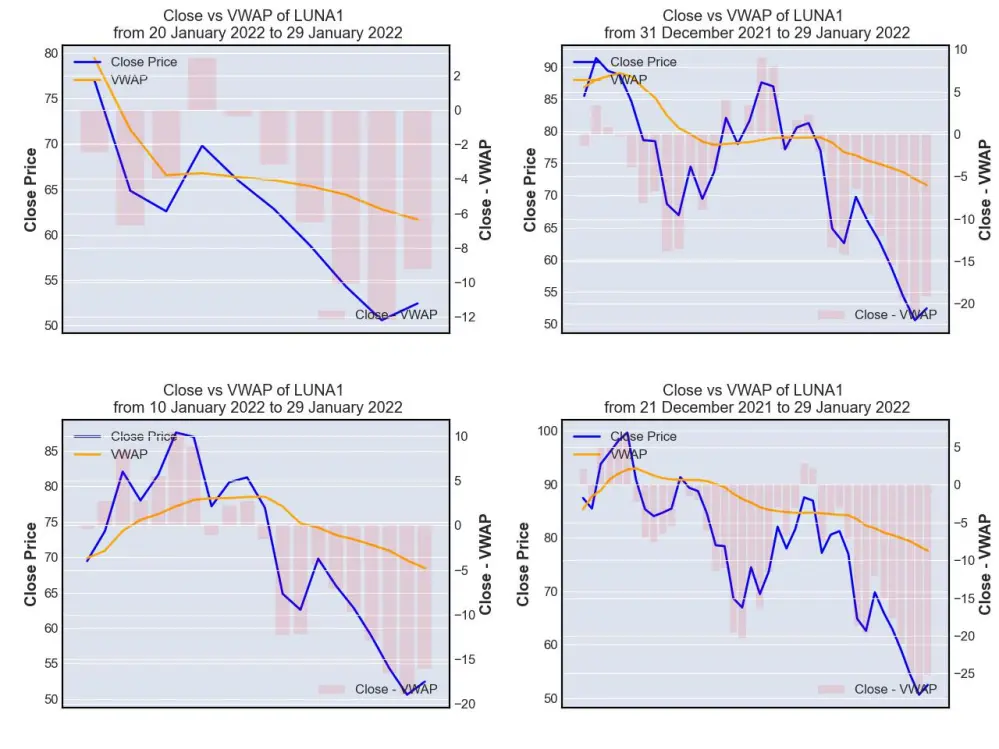
VWAP is a technical indicator used by a trader to gauge the overall trend of an asset price movement. VWAP line (orange line) represents the volume-weighted average price (average price here is defined as the average of high, low and close prices) while close price line (blue line) represents the price when LUNA is closed at the end of every single day.
Whenever blue line (close price) is above orange line (VWAP), it indicates that the asset is gaining momentum and being traded higher than its average price level. This would represent a 'buy' opportunity for short-term momentum trader whom task is to trade following the trend while a longer term mean-revision trader might take it as a 'sell' opportunity, anticipating that the price of LUNA (blue line) to fall to its average level (orange line).
Whenever blue line (close price) is below orange line (VWAP), it indicates that the asset is losing momentum and being traded lower than its average price level. This would represent a 'sell' opportunity for short-term momentum trader whom task is to trade following the trend while a longer term mean-revision trader might take it as a 'buy' opportunity, anticipating that the price of LUNA (blue line) to rise to its average level (orange line).
As of 28 Jan 2022, VWAP is suggesting that LUNA is losing momentum at a rapid pace and is now trading way below its week-long and month-long volume weighted averages.
4.2. Moving Average Convergence Divergence (MACD)
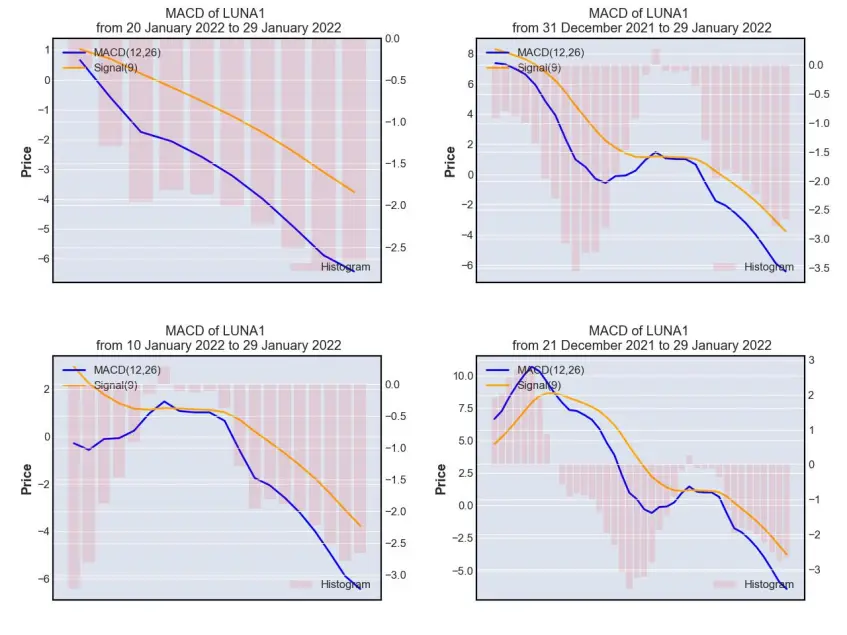
MACD is often used by trader as a momentum indicator. There are 2 lines that form the above charts, namely MACD (12, 26) lines and Signal(9) line, while the histogram is calculated by subtracting Signal (9) from MACD (12,26). Histogram would fall to the negative territory whenever MACD (12, 26) is trending at a lower level than Signal (9) and rise to the positive territory whenever MACD (12,26) is trending at a higher level than Signal (9).
MACD (12, 26) is computed by subtracting the 26-day exponential moving average (EMA) of LUNA closing price from its 12-day EMA.
Signal (9) on the other hand is calculated as the 9-day EMA of MACD (12,26).
As MACD (12, 26) goes higher away from Signal (9), it signifies that LUNA is gaining momentum and whenever it goes trends at a lower level than Signal (9),it signifies that LUNA is losing momentum.
As of 28 Jan 2022, MACD is suggesting that LUNA is in a very bearish position and has been losing value fast.
4.3. Bollinger Band
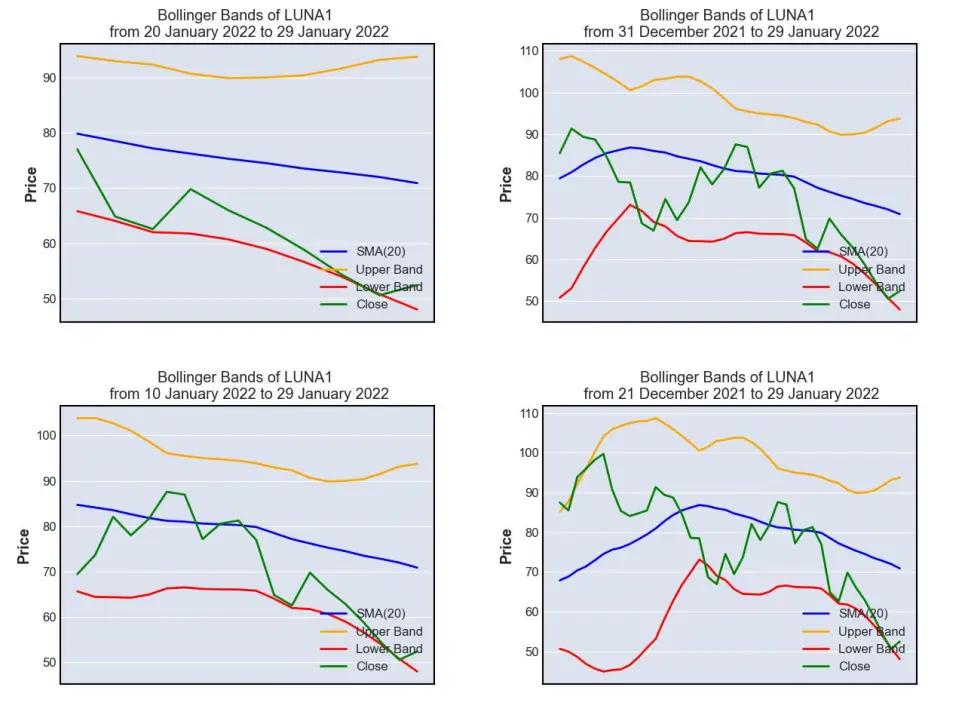
Bollinger band is often being used by mean-reversion trader as a gauge to assess how undervalued or overvalued an asset is. Its chart made up of 4 lines, namely:
- SMA (20) (blue line), which is the 20-day simple moving average price of LUNA
- Upper Band (orange line), which is computed by adding 2 standard deviations of LUNA on SMA (20)
- Lower Band (red line) , which is computed by subtracting 2 standard deviations of LUNA from SMA (20)
- Close (green line), which is the daily closing price of LUNA
Whenever close line (green) touches the lower band (red), it indicates that LUNA is corrected too much and is being traded at an undervalued level, representing a 'buy' opportunity. On the other hand, whenever close line (green) touches the upper band (orange), it indicates that LUNA is gaining too much momentum and is being traded at an overvalued level, thus indicating a 'sell' opportunity.
As of 28 Jan 2022, Bollinger Band is suggesting that LUNA has been heavily oversold and is now threading around its support zone.
4.4. Relative Strength Index (RSI)
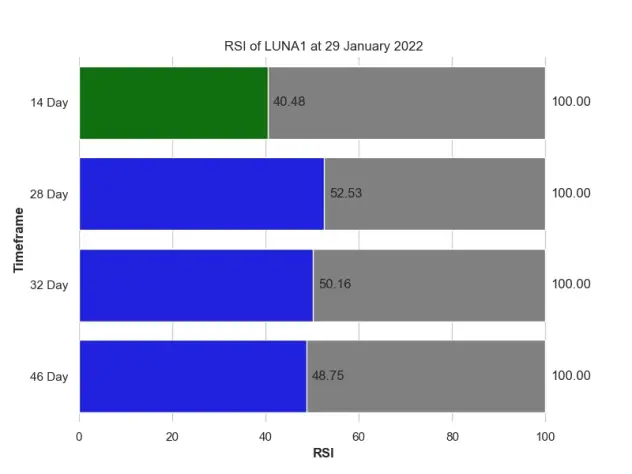
Just like Bollinger Band, Relative Strength Index is often being used by mean-reversion trader as a gauge to assess how undervalued or overvalued an asset is. There are 2 psychological levels, i.e. 30 and 70 in RSI. Whenever the RSI reaches 30, it indicates that LUNA is corrected too much and is being traded at an undervalued level, representing a 'buy' opportunity. On the other hand, whenever RSI reaches 70, it indicates that LUNA is gaining too much momentum and is being traded at an overvalued level, thus indicating a 'sell' opportunity.
As of 28 Jan 2022, RSI is suggesting that LUNA was oversold in the 14-day moving average window.
4.5. Volume and Price Analysis
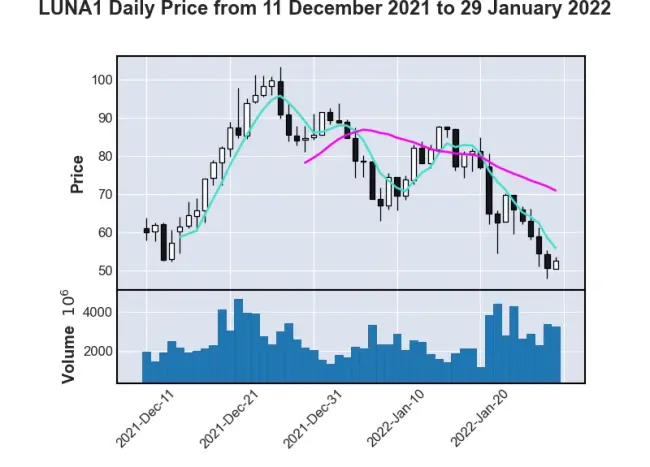
A large volume of LUNA has been sold over the last 9 days, depressing LUNA's price significantly. LUNA's daily active trading volume during normal days would usually be lower than we have seen in the past week. This could mean that a lot of LUNA HODLers are selling LUNA as the market turned against them in the midst of Wonderland saga.
Based on the technical analysis presented above, quantdoge is neutral on LUNA, but I could be wrong, hence please make your careful due diligence before making any financial decision.
5. Terra Risk Profile
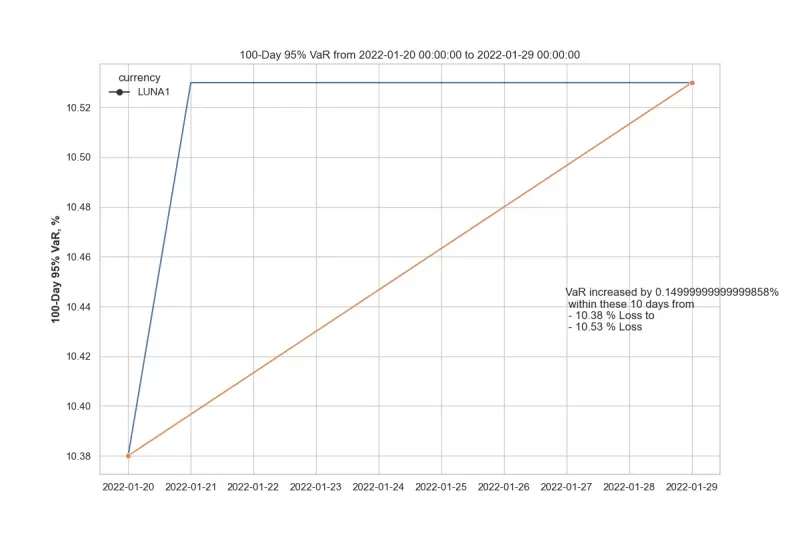
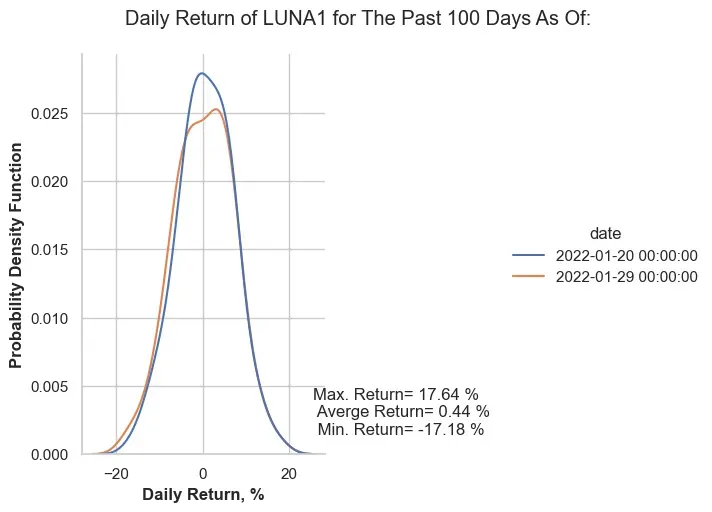
Based on the 100-day 95% historical Value-at-Risk (VaR) profile of Terra defined above, LUNA seems to trade at a greater risk level on 28 Jan 2022 as compared to 10 days before on 18 Jan 2022, with its biggest pullback being seen at -17.18% on a single day during the last 100 days. However, I could be wrong, hence please make your careful due diligence before making any financial decision.
The probability distribution chart of LUNA's daily return is shifting left (i.e. having greater probability of losing more than 20%), indicating that the downside risk of LUNA remains and becoming more influential at this volatile period.
6. LUNA Community Analytics
Number of LUNA Followers In The Last 30 Days
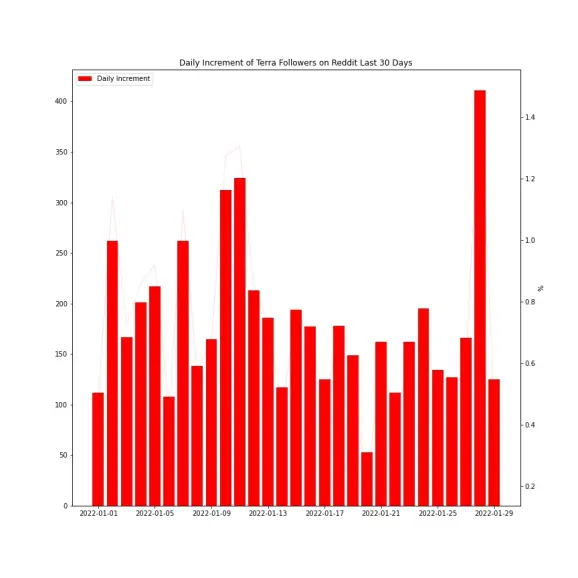
In the last 30 days alone, Terra's subscribers have grown 23.0 % from 22,845 to 28,099 on Reddit.
Daily increment of Terrra's Reddit subscribers peaked on 28 Jan 2022.
On average, 181 new Reddit accounts are subscribing to Terra's subreddit every day.
7. Google Trends Analytics
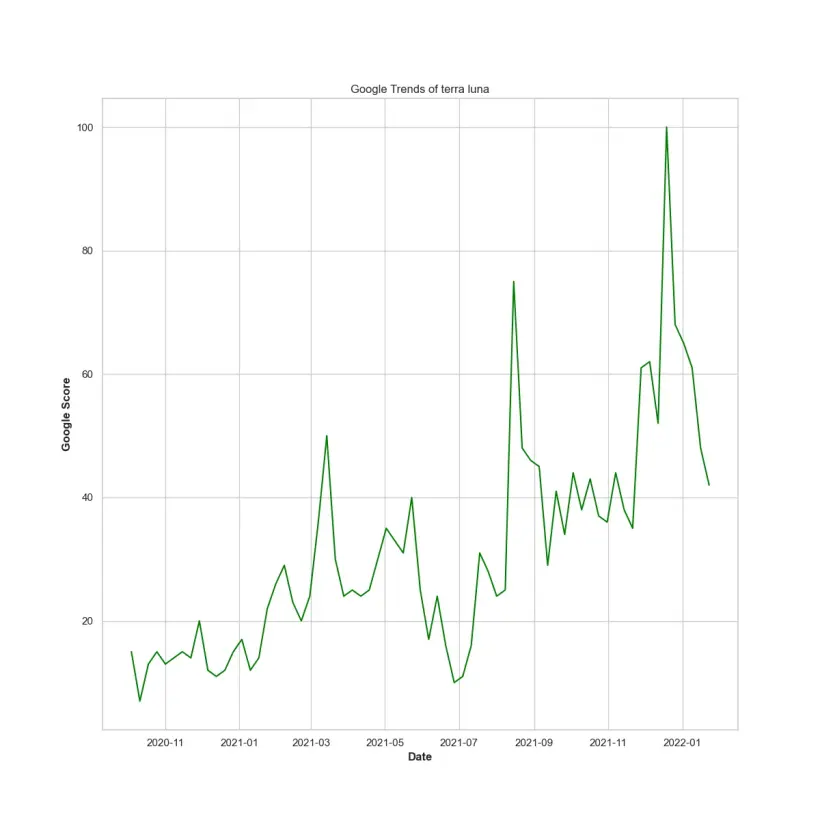
terra luna reached its peak in Google Search on 2021-12-19 with a Google Score of 100
Over the last quarter, terra luna Google Score has increased 21.35 % from 44.5 to 54.0
Over the last 6 months, terra luna Google Score has increased 23.85 % from 43.6 to 54.0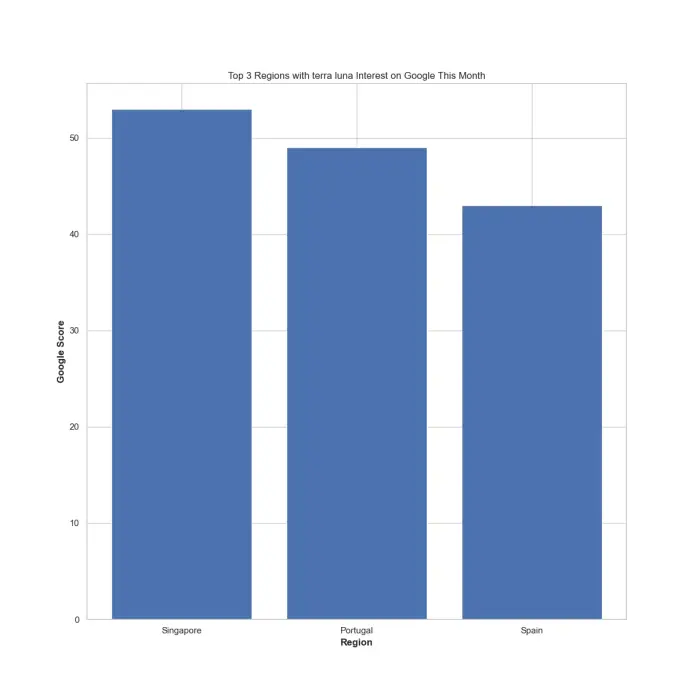
Over the last month, Google interests on terra luna were mainly coming from Singapore, Portugal and Spain, where these 3 countries are high-income and developed nations that offer crypto-friendly legislations and business environments.
8. Binance Futures Analytics
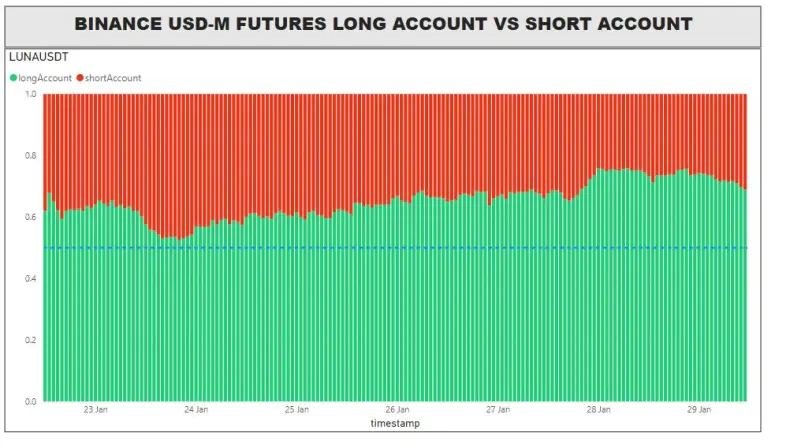
There are more traders taking long position on LUNAUSDT futures as compared to the shorters, and the ratio of long accounts against short accounts is increasing as LUNA continues to dip. However, please take note that this is simply just a comparison of accounts that hold a long position on LUNAUSDT futures against those who take a short position on the same underlying. This analytics does not say anything about buy/ sell volume.
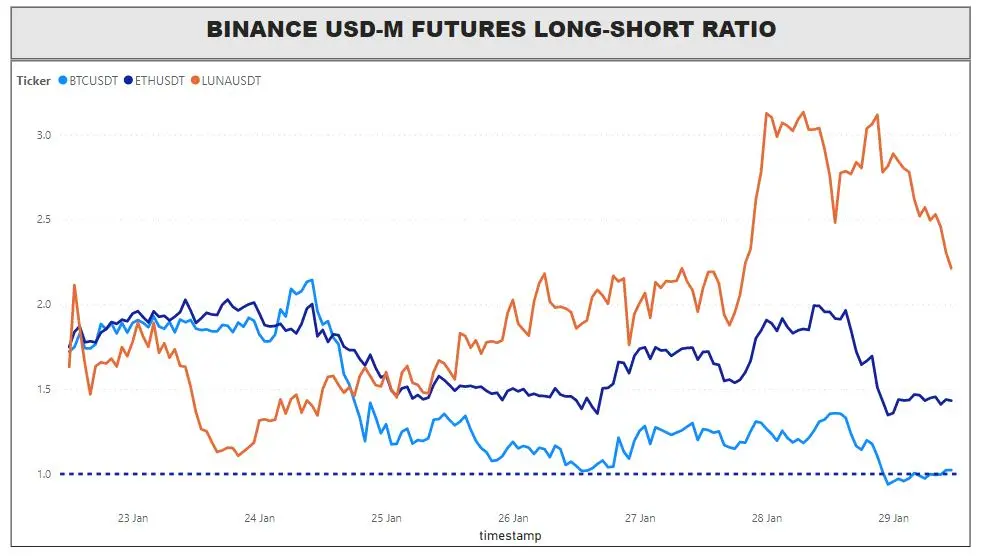
LUNAUSDT long-short ratios remain consistently higher than BTCUSDT and ETHUSDT futures despite the market dip. As crypto market continues to dip, the long-short ratios across these 3 instruments are dropping sharply, especially LUNAUSDT with more traders coming in to take short positions while those who were previously taking long positions are slowly exiting even though LUNAUSDT still in net buying mode with long-short ratio greater than 1.

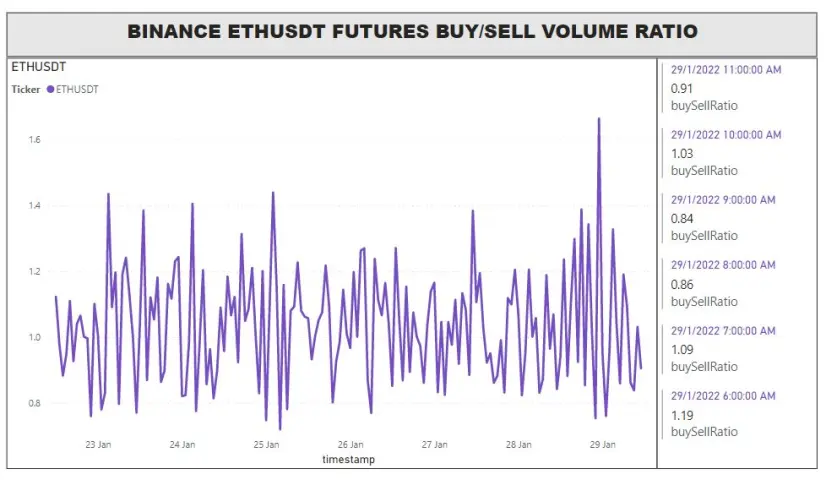
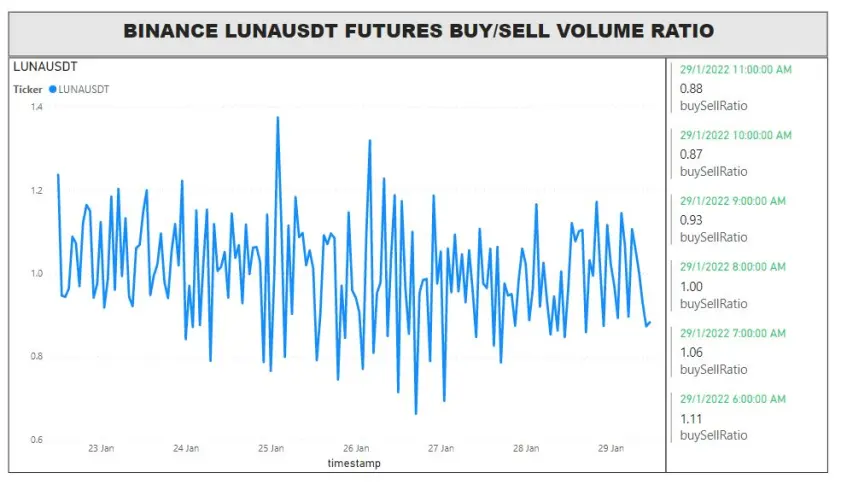
At the time of writing, bears are in control now as there are more sell volumes than the buy volumes across BTCUSDT, ETHUSDT and LUNAUSDT futures.
If you like my analysis and articles, please follow me at @quantdoge for daily updates.
Follow My Twitter for daily updates: https://twitter.com/quantdoge