
Investment Disclaimer:
- I am not a registered investment, legal, or tax adviser or a broker/dealer, and all opinions expressed by me are from my research for educational purposes only.
- Past performance presented here is not an indicator of future performance.
- This post expresses my own opinion about the cryptocurrency mentioned herein and is not an offer to buy or sell, or a solicitation of any offer to buy or sell the cryptocurrency mentioned in this post.
1A. Top 3 Good News for AXS HODLERS !!!
-
Axie Infinity and Fantom Among the Top Altcoin Gainers This Year With Growth of 13,428% or More: CryptoDiffer
Statistic as of 2021-11-17 07:08 AM EDT: 9 positive votes, 1 negative vote
Blockchain news and updates outlet CryptoDiffer is revealing that blockchain-based game Axie Infinity, along with smart contract platforms Fantom and Solana are among the top altcoin performers this year. CryptoDiffer tells its 258,000 Twitter followers that Axie Infinity (AXS) is the hottest altcoin this year, printing gains of over 26,000% in just 10 months.
(Extracted from Crypto Panic) -
Samsung backs blockchain-based gaming, invests in Axie Infinity
Statistic as of 2021-11-17 07:08 AM EDT: 9 positive votes, 1 negative vote
South Korean conglomerate Samsung is increasingly involved in the burgeoning world of blockchain-based gaming, while within Korea, games with blockchain elements are banned from official release in the country. Fast facts Samsung Next, the tech giant’s investment subsidiary, participated in a US$152 million Series B round of Sky Mavis, the Vietnam-based blockchain game company who founded Axie Inifnity.
(Extracted from Crypto Panic) -
Ethereum-Powered NFT-Based Game Axie Infinity ($AXS) Very Popular in Emergent Nations
Statistic as of 2021-11-17 07:08 AM EDT: 6 positive votes, 1 negative vote
Monster-battle and non-fungible token (NFT) based game Axie Infinity is rapidly gaining popularity among workers in developing countries as a potential avenue for income.
(Extracted from Crypto Panic)
1B. Top 2 Bad News for AXS HODLERS !!!
- Axie Infinity tweet suggests willingness to work with Philippines on tax demand
Statistic as of 2021-11-17 07:09 AM EDT: 0 positive vote, 7 negative votes
Axie Infinity, one of the world’s most popular non-fungible token (NFT) games, tweeted that it is “looking forward to working with physical nations” and called for its digital users to abide by the laws of their home countries, presumably a reference to local tax laws.
(Extracted from Crypto Panic) - Axie Infinity Profits Subject to Income Tax: Philippines Regulator
Statistic as of 2021-11-17 07:09 AM EDT: 0 positive vote, 4 negative votes
The Finance Undersecretary of the Philippines, Antonette C. Tiono, said that earnings from games like Axie Infinity are subject to income tax.
(Extracted from Crypto Panic)
2. How Axie Performs Relative to Other Cryptos ?

As of 16 Nov 2021, Axie Inifnity has made a cumulative return of 5,506.78% since Jan 2020 and 1,363.78% since Jan 2021. It is currently the 7th greatest performing crypto asset since Jan 2021 as compared to the other cryptocurrencies presented above.
3. Technical Analysis on Axie Infinity
3.1. Volume Weighted Average Price (VWAP)

VWAP is a technical indicator used by a trader to gauge the overall trend of an asset price movement. VWAP line (orange line) represents the volume-weighted average price (average price here is defined as the average of high, low and close prices) while close price line (blue line) represents the price when AXS is closed at the end of every single day.
Whenever blue line (close price) is above orange line (VWAP), it indicates that the asset is gaining momentum and being traded higher than its average price level. This would represent a 'buy' opportunity for short-term momentum trader whom task is to trade following the trend while a longer term mean-revision trader might take it as a 'sell' opportunity, anticipating that the price of AXS (blue line) to fall to its average level (orange line).
Whenever blue line (close price) is below orange line (VWAP), it indicates that the asset is losing momentum and being traded lower than its average price level. This would represent a 'sell' opportunity for short-term momentum trader whom task is to trade following the trend while a longer term mean-revision trader might take it as a 'buy' opportunity, anticipating that the price of AXS (blue line) to rise to its average level (orange line).
As of 16 Nov 2021, VWAP is suggesting that AXS is losing momentum.
3.2. Moving Average Convergence Divergence (MACD)
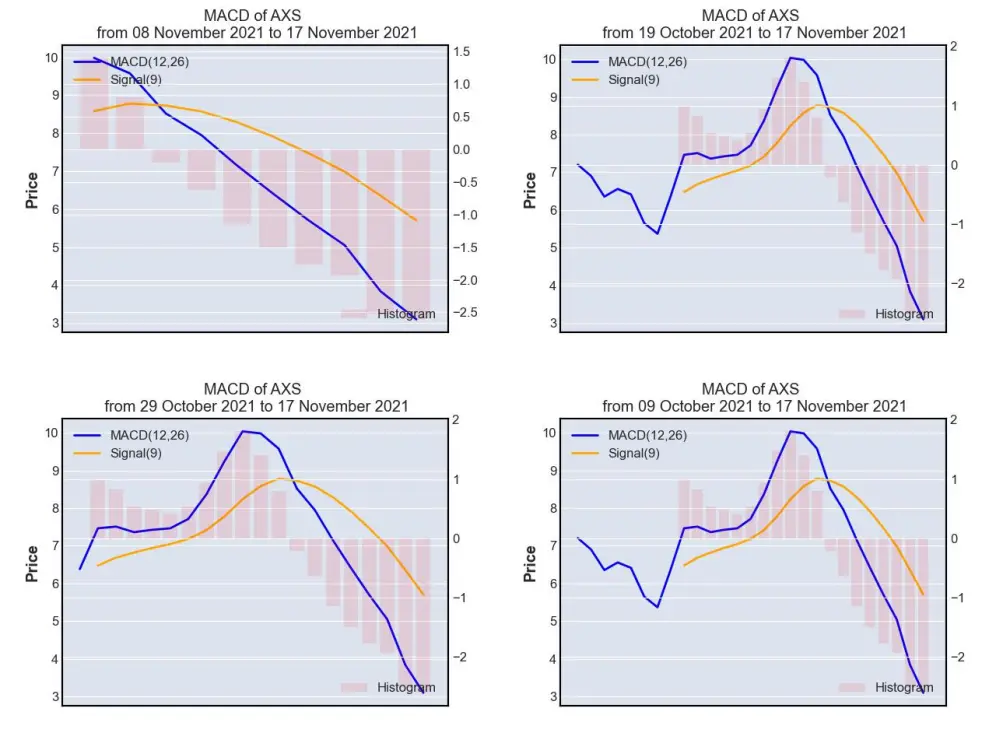
MACD is often used by trader as a momentum indicator. There are 2 lines that form the above charts, namely MACD (12, 26) lines and Signal(9) line, while the histogram is calculated by subtracting Signal (9) from MACD (12,26). Histogram would fall to the negative territory whenever MACD (12, 26) is trending at a lower level than Signal (9) and rise to the positive territory whenever MACD (12,26) is trending at a higher level than Signal (9).
MACD (12, 26) is computed by subtracting the 26-day exponential moving average (EMA) of AXS closing price from its 12-day EMA.
Signal (9) on the other hand is calculated as the 9-day EMA of MACD (12,26).
As MACD (12, 26) goes higher away from Signal (9), it signifies that AXS is gaining momentum and whenever it goes trends at a lower level than Signal (9),it signifies that AXS is losing momentum.
As of 16 Nov 2021, MACD is suggesting that AXS is losing significant momentum.
3.3. Bollinger Band

Bollinger band is often being used by mean-reversion trader as a gauge to assess how undervalued or overvalued an asset is. Its chart made up of 4 lines, namely:
- SMA (20) (blue line), which is the 20-day simple moving average price of AXS
- Upper Band (orange line), which is computed by adding 2 standard deviations of AXS on SMA (20)
- Lower Band (red line) , which is computed by subtracting 2 standard deviations of AXS from SMA (20)
- Close (green line), which is the daily closing price of AXS
Whenever close line (green) touches the lower band (red), it indicates that AXS is corrected too much and is being traded at an undervalued level, representing a 'buy' opportunity. On the other hand, whenever close line (green) touches the upper band (orange), it indicates that AXS is gaining too much momentum and is being traded at an overvalued level, thus indicating a 'sell' opportunity.
As of 16 Nov 2021, Bollinger Band is suggesting that AXS is neither overbought nor oversold.
3.4. Relative Strength Index (RSI)
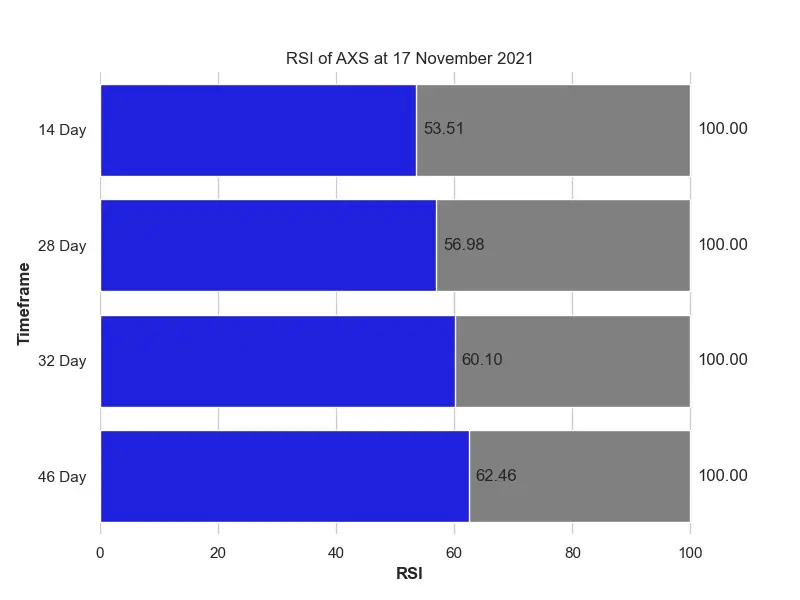
Just like Bollinger Band, Relative Strength Index is often being used by mean-reversion trader as a gauge to assess how undervalued or overvalued an asset is. There are 2 psychological levels, i.e. 30 and 70 in RSI. Whenever the RSI reaches 30, it indicates that AXS is corrected too much and is being traded at an undervalued level, representing a 'buy' opportunity. On the other hand, whenever RSI reaches 70, it indicates that AXS is gaining too much momentum and is being traded at an overvalued level, thus indicating a 'sell' opportunity.
As of 16 Nov 2021, RSI is suggesting that AXS is neither overbought nor oversold.
Based on the technical analysis presented above, quantdoge holds a slight bullish stance on the short-term price action of AXS, but I could be wrong, hence please make your careful due diligence before making any financial decision.
4. Axie Infinity Risk Profile
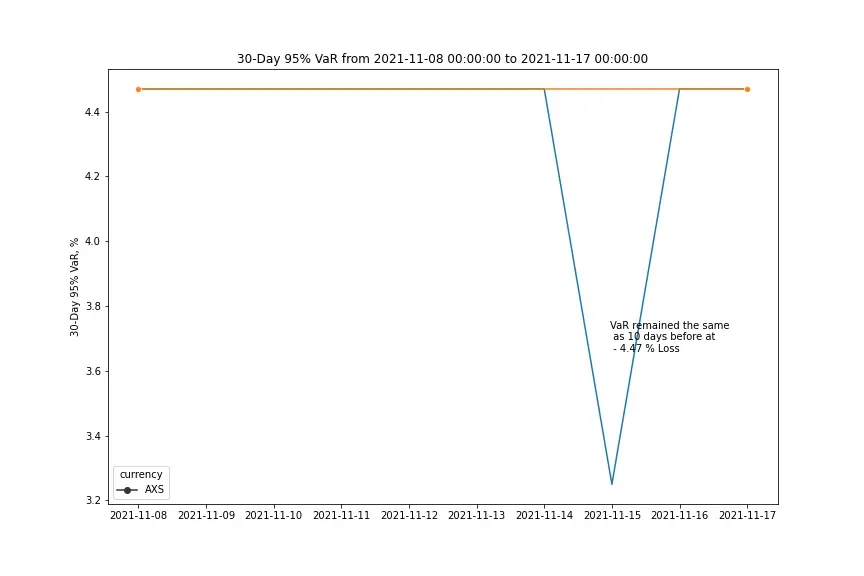
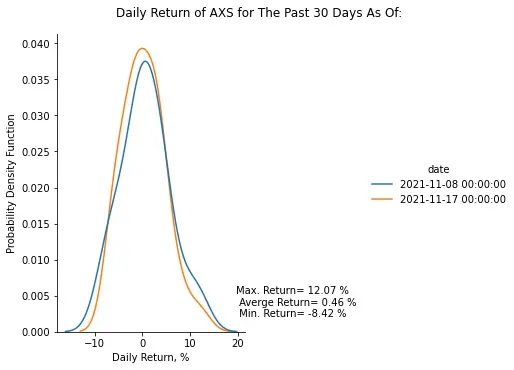
Based on the 30-day 95% historical Value-at-Risk (VaR) profile of Axie Infinity defined above, AXS seems to trade at a similar risk level on 16 Nov 2021 as compared to 10 days before on 06 Nov 2021, with its biggest pullback being seen at - 8.42% on a single day during the last 100 days. However, I could be wrong, hence please make your careful due diligence before making any financial decision.
5. Price Simulation for Axie
How did quantdoge simulation perform vs the actual AXS price movement over the last week ?

Over the last 7 days, AXS has been trading near below the median range of quantdoge simulations, indicating that AXS is oversold, and is trading at a undervalued position.
6. Google Trends Analytics

Axie Infinity reached its peak in Google Search on July 2021 with a Google Score of 83.25.
Over the last quarter, Axie Infinity Google Score has increased 20.75 % from 39.75 to 48.0.
Over the last 6 months, Axie Infinity Google Score has increased 125.88 % from 21.25 to 48.0.
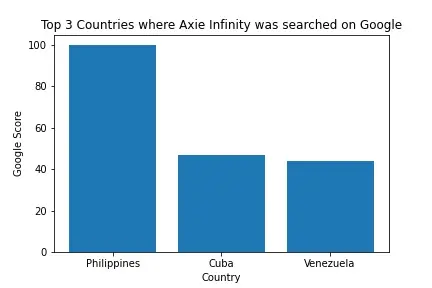
Based on Google searches, AXS is most sought after in Philippines, followed by Cuba and Venezuela.
If you like my analysis and articles, please follow me at @quantdoge for daily updates.






