
Investment Disclaimer:
- I am not a registered investment, legal, or tax adviser or a broker/dealer, and all opinions expressed by me are from my research for educational purposes only.
- Past performance presented here is not an indicator of future performance.
- This post expresses my own opinion about the cryptocurrency mentioned herein and is not an offer to buy or sell, or a solicitation of any offer to buy or sell the cryptocurrency mentioned in this post.
1A. Top 3 Good News for BNB HODLERS !!!
-
Crypto Analyst Says Bitcoin Will Move ‘Like a Runaway Train,’ Predicts Rallies for Binance Coin and Polygon
Statistic as of 2021-11-11 09:57 AM EDT: 32 positive votes, 1 negative vote
A popular crypto trader thinks that Polygon (MATIC) and Binance Coin (BNB) are set to rally before Bitcoin (BTC) ascends towards $100,000. The crypto market analyst known as Altcoin Sherpa tells his 141,900 Twitter followers that Bitcoin may be leaving the last door open for buyers to accumulate before taking off on its next leg […]
(Extracted from Crypto Panic) -
Binance Just Took Over Half A Billion Dollars Worth Of BNB Completely Out Of Circulation In 17th Quarterly Burn
Statistic as of 2021-11-11 09:57 AM EDT: 10 positive votes, 0 negative vote
On Tuesday, Binance announced that it had burned 1,335,888 BNB valued at approximately $639,462,868. Coin burning is a process by which cryptocurrency miners or exchanges periodically take out a certain portion of coins from circulation to control price through supply restriction. This has been a common practice in the cryptocurrency industry and is done to […]
(Extracted from Crypto Panic) -
New proposal aims to raise Binance Coin value by burning BSC fees
Statistic as of 2021-11-11 09:57 AM EDT: 6 positive votes, 0 negative vote
The new BEP might decrease the total amount of BNB that validators and delegators obtain from staking.
(Extracted from Crypto Panic)
1B. Top Bad News for BNB HODLERS !!!
- Legal expert says Tether and Binance Coin (BNB) are likely picks for SEC lawsuit
Statistic as of 2021-11-11 09:58 AM EDT: 4 positive votes, 21 negative votes
Attorney Jeremy Hogan gave his legal assessment of the top five cryptocurrencies naming Tether and Binance Coin as at risk on the “SEC danger rating.”
(Extracted from Crypto Panic)
2. How Binance Coin Performs Relative to Other Cryptos ?

As of 10 Nov 2021, Binance Coin has made a cumulative return of 4573.32% since Jan 2020 and 1647.5% since Jan 2021. It is currently the 5th greatest performing crypto asset since Jan 2021 as compared to the other cryptocurrencies presented above.
3. Technical Analysis on Binance Coin
3.1. Volume Weighted Average Price (VWAP)
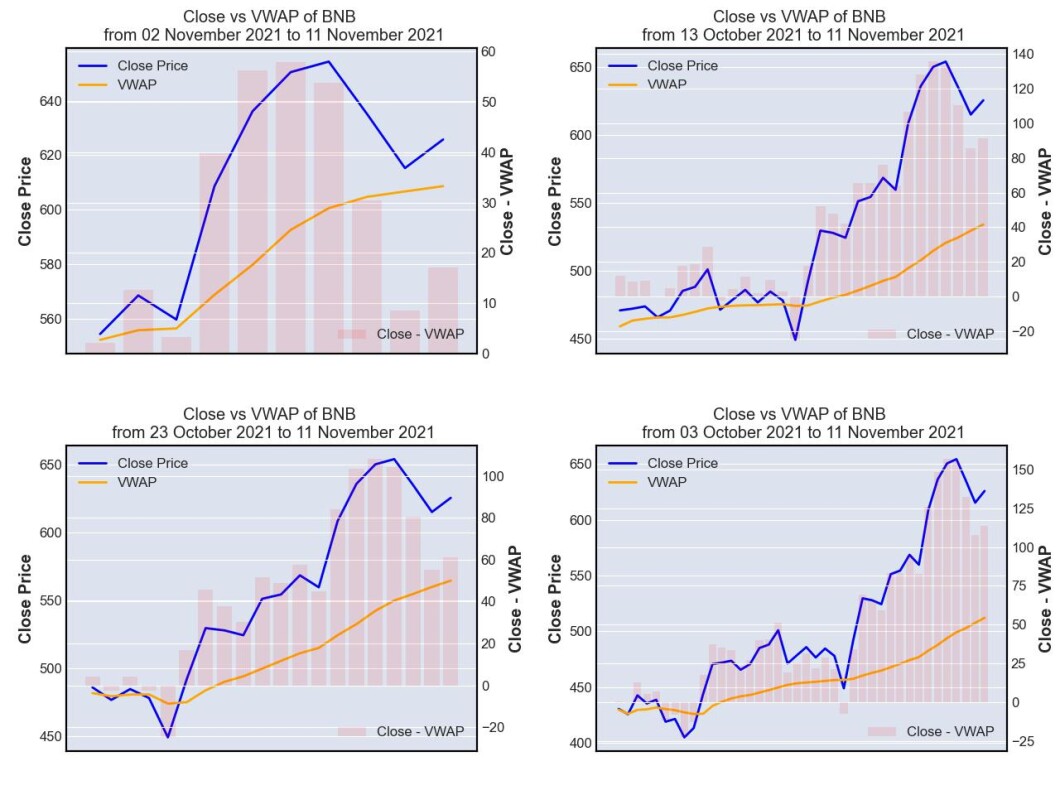
VWAP is a technical indicator used by a trader to gauge the overall trend of an asset price movement. VWAP line (orange line) represents the volume-weighted average price (average price here is defined as the average of high, low and close prices) while close price line (blue line) represents the price when BNB is closed at the end of every single day.
Whenever blue line (close price) is above orange line (VWAP), it indicates that the asset is gaining momentum and being traded higher than its average price level. This would represent a 'buy' opportunity for short-term momentum trader whom task is to trade following the trend while a longer term mean-revision trader might take it as a 'sell' opportunity, anticipating that the price of BNB (blue line) to fall to its average level (orange line).
Whenever blue line (close price) is below orange line (VWAP), it indicates that the asset is losing momentum and being traded lower than its average price level. This would represent a 'sell' opportunity for short-term momentum trader whom task is to trade following the trend while a longer term mean-revision trader might take it as a 'buy' opportunity, anticipating that the price of BNB (blue line) to rise to its average level (orange line).
As of 10 Nov 2021, VWAP is suggesting that BNB is gaining significant momentum.
3.2. Moving Average Convergence Divergence (MACD)

MACD is often used by trader as a momentum indicator. There are 2 lines that form the above charts, namely MACD (12, 26) lines and Signal(9) line, while the histogram is calculated by subtracting Signal (9) from MACD (12,26). Histogram would fall to the negative territory whenever MACD (12, 26) is trending at a lower level than Signal (9) and rise to the positive territory whenever MACD (12,26) is trending at a higher level than Signal (9).
MACD (12, 26) is computed by subtracting the 26-day exponential moving average (EMA) of BNB closing price from its 12-day EMA.
Signal (9) on the other hand is calculated as the 9-day EMA of MACD (12,26).
As MACD (12, 26) goes higher away from Signal (9), it signifies that BNB is gaining momentum and whenever it goes trends at a lower level than Signal (9),it signifies that BNB is losing momentum.
As of 10 Nov 2021, MACD is suggesting that BNB is gaining significant momentum.
3.3. Bollinger Band

Bollinger band is often being used by mean-reversion trader as a gauge to assess how undervalued or overvalued an asset is. Its chart made up of 4 lines, namely:
- SMA (20) (blue line), which is the 20-day simple moving average price of BNB
- Upper Band (orange line), which is computed by adding 2 standard deviations of BNB on SMA (20)
- Lower Band (red line) , which is computed by subtracting 2 standard deviations of BNB from SMA (20)
- Close (green line), which is the daily closing price of BNB
Whenever close line (green) touches the lower band (red), it indicates that BNB is corrected too much and is being traded at an undervalued level, representing a 'buy' opportunity. On the other hand, whenever close line (green) touches the upper band (orange), it indicates that BNB is gaining too much momentum and is being traded at an overvalued level, thus indicating a 'sell' opportunity.
As of 10 Nov 2021, Bollinger Band is suggesting that BNB is neither oversold nor overbought.
3.4. Relative Strength Index (RSI)

Just like Bollinger Band, Relative Strength Index is often being used by mean-reversion trader as a gauge to assess how undervalued or overvalued an asset is. There are 2 psychological levels, i.e. 30 and 70 in RSI. Whenever the RSI reaches 30, it indicates that BNB is corrected too much and is being traded at an undervalued level, representing a 'buy' opportunity. On the other hand, whenever RSI reaches 70, it indicates that BNB is gaining too much momentum and is being traded at an overvalued level, thus indicating a 'sell' opportunity.
As of 10 Nov 2021, RSI is suggesting that BNB is near to overbought.
Based on the technical analysis presented above, quantdoge holds a neutral stance on the short-term price action of BNB, but I could be wrong, hence please make your careful due diligence before making any financial decision.
4. Binance Coin Risk Profile


Based on the 100-day 95% historical Value-at-Risk (VaR) profile of Binance Coin defined above, BNB seems to trade at a similar risk level on 10 Nov 2021 as compared to 10 days before on 31 Oct 2021, with its biggest pullback being seen at -17.21% on a single day during the last 100 days. However, I could be wrong, hence please make your careful due diligence before making any financial decision.
5. Price Simulation for Binance Coin
How did quantdoge simulation perform vs the actual BNB price movement over the last week ?

Over the last 7 days, BNB has been trading below the median of quantdoge simulations, indicating that BNB was overbought.
6. BNB Community Analytics
Number of BNB Followers In The Past 24 Months
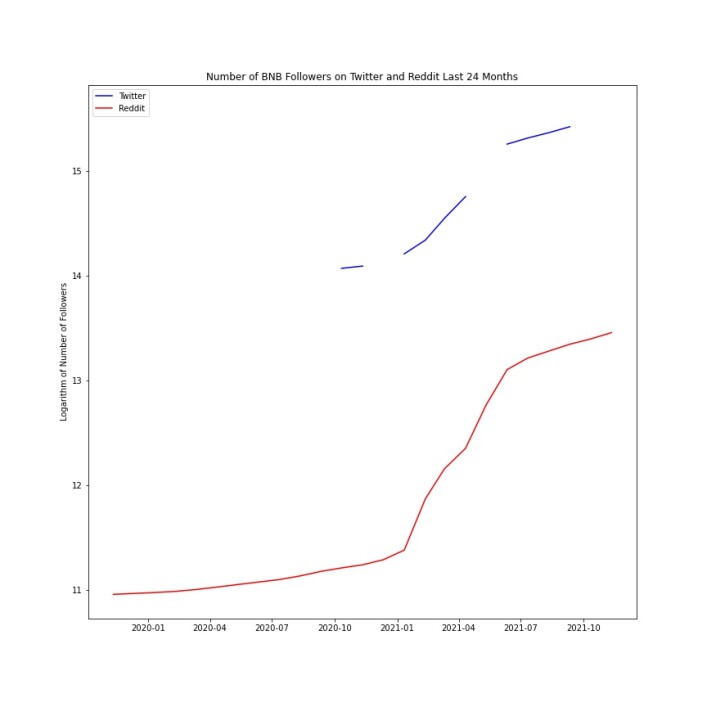
During the past 24 months, Binance Coin followers have grown 456.71 % from 1,061,520.0 to 5,909,537.0 on Twitter and grown 1118.43 % from 57,319 to 698,392 on Reddit.


Monthly increment of Binance Coin Twitter followers peaked on Apr 2021 and its monthly increment of Reddit followers peaked on Jun 2021.
Number of BNB Followers In The Last 30 Days
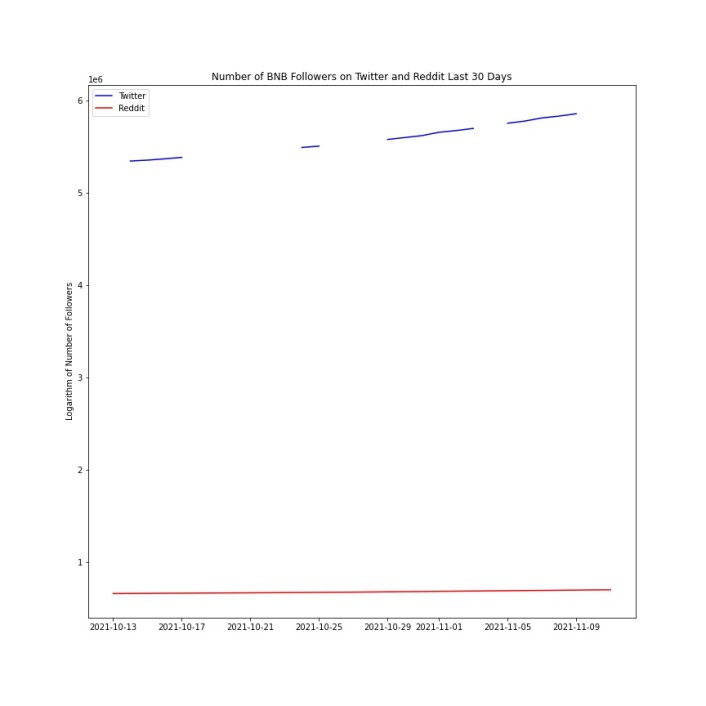
In the last 30 days alone, Binance Coin followers have grown 10.56% from 5,344,991 to 5,909,537 on Twitter and grown 6.08 % from 658,355 to 698,392 on Reddit.
 Daily incr
 ement of Binance Coin Twitter followers peaked on 01 Nov 2021 and its daily increment of Reddit followers peaked on 10 Nov 2021.
If you like my analysis and articles, please follow me at @quantdoge for daily updates.


