
Investment Disclaimer:
- I am not a registered investment, legal, or tax adviser or a broker/dealer, and all opinions expressed by me are from my research for educational purposes only.
- Past performance presented here is not an indicator of future performance.
- This post expresses my own opinion about the cryptocurrency mentioned herein and is not an offer to buy or sell, or a solicitation of any offer to buy or sell the cryptocurrency mentioned in this post.
- I do hold a long position in INJ as a token holder.
This analytics report was written as a follow-up from 12 JAN 2022 (WED)- Injective Protocol (INJ) Report Card.
1A. What is Injective Protocol?
Introduction
Injective Protocol is a decentralized cross-chain derivatives trading platform that is also hosted on a decentralized peer-to-peer network (i.e. InterPlanetary File System) as opposed to some DeFi platforms which are hosted on centralized servers like AWS, Azure or GCP, hence, making it more censorship resistance. Injective Protocol is built with Ethermint and implemented as a Cosmos SDK module. All operations that are happening on Injective Protocol are recorded and validated via Cosmos Tendermint-based Proof-of-Stake protocol.
Problems with DEX that Injective Protocol Is Solving
Decentralized Exchanges (DEX) which were traditionally built on Ethereum main net are usually slow in confirmation and suffer high gas fees whenever the traffic is congested, making them not suitable for intraday trading, which resulted in many users still resorting to centralized exchanges like Coinbase, Binance, KuCoin and FTX among others to conduct their trading activities. Injective Protocol is solving this problem by allowing digital assets from several other blockchains to be bridged to their layer-2 injective chain which offers lightning-fast execution speed and zero gas fees.
Front running is also a big problem in most DEX as Ethereum miners are able to arbitrage internally by re-ordering the transactions within the blocks that they produce, but Injective Protocol solves this issue by utilizing Verifiable Delay Function (VDF) to prevent front-running.
Product Offering and Unique Features that Can Be Found Only On Injective Protocol
Unlike other Automated Market Making protocols like UniSwap and SushiSwap which rely on liquidity pools supplied by different users and maintained via a constant product formula , Injective Protocol offers an order book-based system and allows its users to trade on not just spots/ pairs that most DEX provides, but derivatives with leveraging capability like perpetual futures, swaps and margin trading which are hardly available in most of the DEX that are currently available.
Injective Protocol Buyback and Burn Mechanisms
In order to ensure that INJ tokens are deflationary and encourage users to stake INJ, the protocol has a buyback and burn mechanism which targets to burn 60% of all exchange fees every week where users could bid for the fees collected (e.g. ETH, WBTC) at a discounted price, but all biddings can only be done using INJ tokens. Bidders who offer the most competitive price would be selected and the INJ tokens paid to acquire these fees would be immediately burnt.
1B. Injective Protocol Project Updates
- Injective Yield Farming on Solana
Users can begin to earn a projected 20% APY on their wINJ on the Solana DeFi protocol. Injective is an interoperable chain built using the Cosmos SDK that seeks to bring together the multichain world through innovative applications. This also marks one of the first times that a Cosmos SDK based chain has transferred tokens to Solana. - Institutional Staking: Copper Integrates INJ
Institutional crypto custody provider Copper has integrated the Injective mainnet this month, unlocking a diverse array of new opportunities for INJ staking. Currently Copper only supports staking for 13 popular assets such as Helium, Cardano, Polkadot and Algorand. - Injective Bridge V2 Release: Cross-Chain Interoperability Across Cosmos and Ethereum
Injective Bridge V2 brings superior user experience alongside vastly lower fees for all Ethereum and Cosmos users. New Injective ecosystem DApps will find the bridge to be extraordinarily helpful since it’ll allow them to easily onboard.
2. How Injective Performs Relative to Other Cryptos ?
Performance of All Cryptos Under Quantdoge Watchlist since 2021 (Sorted by % Return)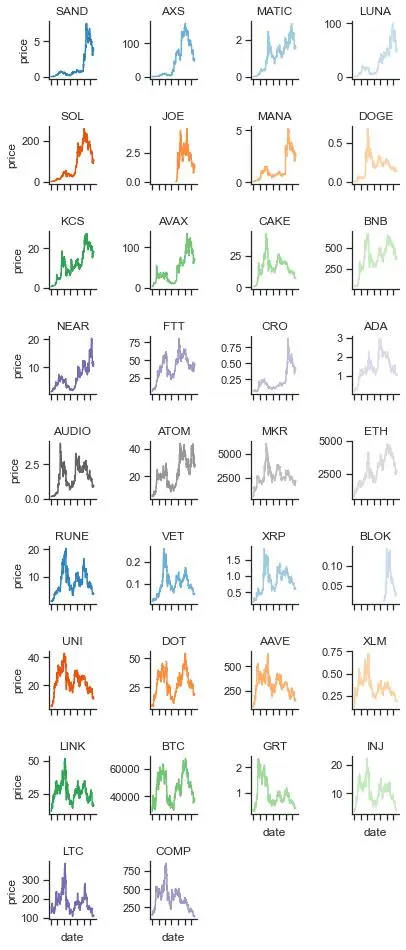
INJ has undergone 1.89% return from USD 4.0432 to USD 4.1197 (39.36% lower than 12 Jan 2022 snapshot) since 01 Jan 2021. INJ is the 32th best performing crypto assets among others here.
3. How Resilience Injective Is Towards Bitcoin Crash Relative to Other Cryptos ?
Historically, all altcoins are somewhat dependent on Bitcoin price movement and it’s often the case where if Bitcoin falls, most altcoins would follow.
Top 3 Cryptos That Are Most Resilient To Bitcoin Crash During Each of BTC 4 Largest Crashes in 2021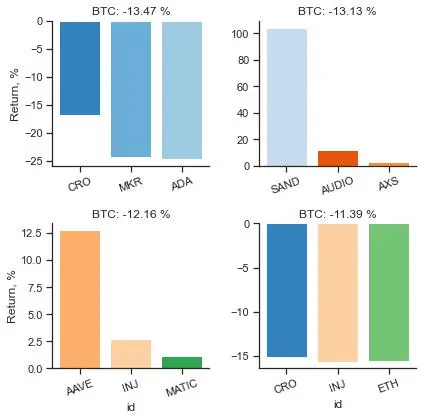
INJ has proven resilience against BTC crash in 2 out of the 4 instances.
During the last 4 BTC market crashes,
When BTC dropped by -13.47 %, INJ returned -33.81 % at 20 May 2021,
When BTC dropped by -13.13 %, INJ returned -16.9 % at 22 January 2021,
When BTC dropped by -12.16 %, INJ returned 2.74 % at 13 May 2021,
When BTC dropped by -11.39 %, INJ returned -15.63 % at 22 June 2021
4. Technical Analysis on Injective
4.1. Volume Weighted Average Price (VWAP)
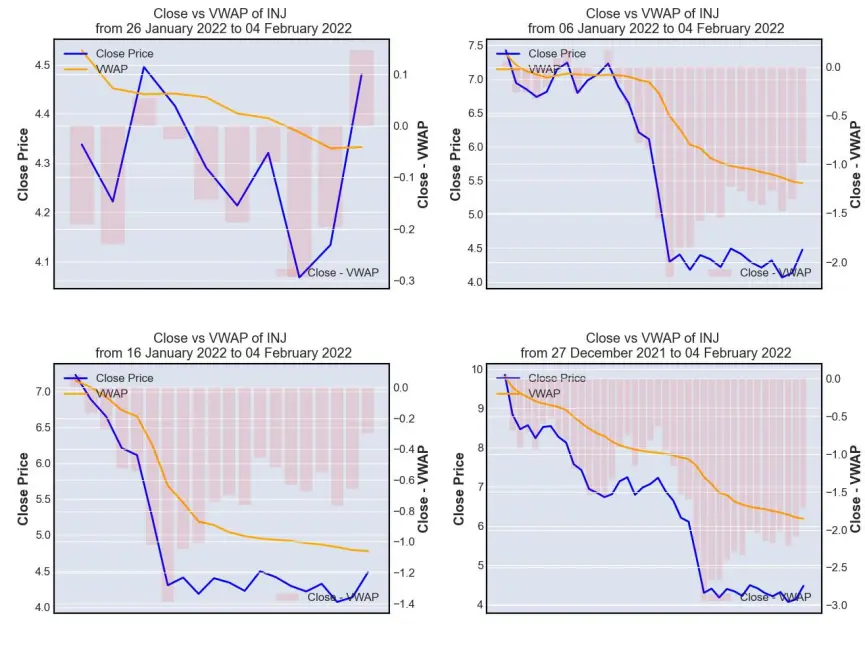
VWAP is a technical indicator used by a trader to gauge the overall trend of an asset price movement. VWAP line (orange line) represents the volume-weighted average price (average price here is defined as the average of high, low and close prices) while close price line (blue line) represents the price when INJ is closed at the end of every single day.
Whenever blue line (close price) is above orange line (VWAP), it indicates that the asset is gaining momentum and being traded higher than its average price level. This would represent a 'buy' opportunity for short-term momentum trader whom task is to trade following the trend while a longer term mean-revision trader might take it as a 'sell' opportunity, anticipating that the price of INJ (blue line) to fall to its average level (orange line).
Whenever blue line (close price) is below orange line (VWAP), it indicates that the asset is losing momentum and being traded lower than its average price level. This would represent a 'sell' opportunity for short-term momentum trader whom task is to trade following the trend while a longer term mean-revision trader might take it as a 'buy' opportunity, anticipating that the price of INJ (blue line) to rise to its average level (orange line).
As of 04 Feb 2022, VWAP is suggesting that INJ has been losing a lot of momentum and is now trading at a deep discount from its month-long volume-weighted average price.
4.2. Moving Average Convergence Divergence (MACD)
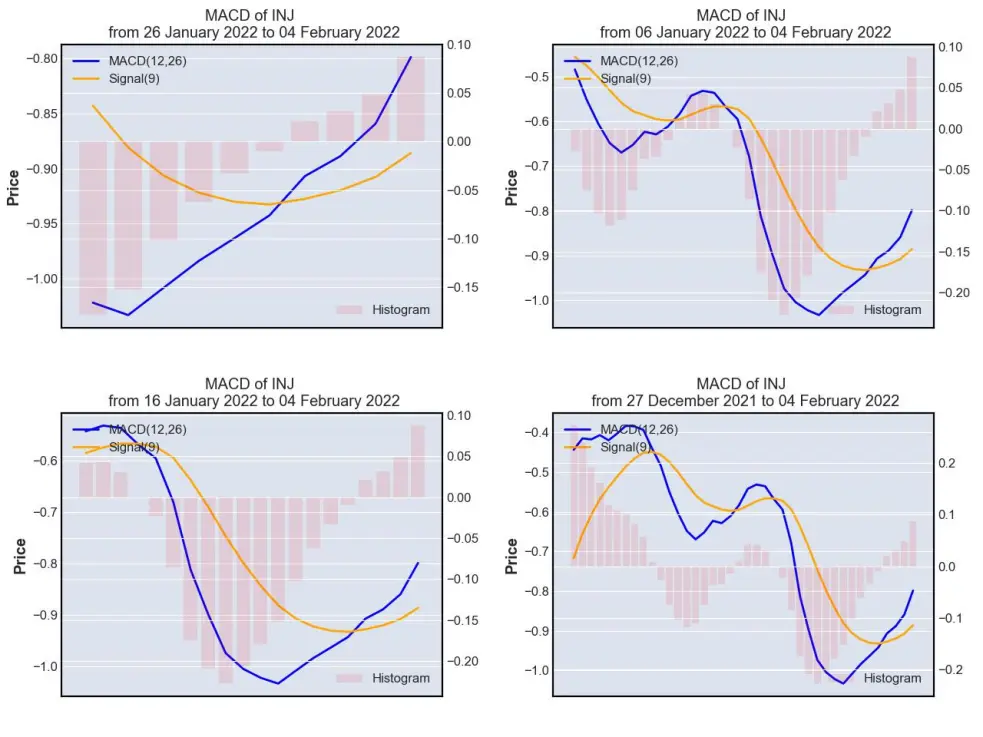
MACD is often used by trader as a momentum indicator. There are 2 lines that form the above charts, namely MACD (12, 26) lines and Signal(9) line, while the histogram is calculated by subtracting Signal (9) from MACD (12,26). Histogram would fall to the negative territory whenever MACD (12, 26) is trending at a lower level than Signal (9) and rise to the positive territory whenever MACD (12,26) is trending at a higher level than Signal (9).
MACD (12, 26) is computed by subtracting the 26-day exponential moving average (EMA) of INJ closing price from its 12-day EMA.
Signal (9) on the other hand is calculated as the 9-day EMA of MACD (12,26).
As MACD (12, 26) goes higher away from Signal (9), it signifies that INJ is gaining momentum and whenever it goes trends at a lower level than Signal (9),it signifies that INJ is losing momentum.
As of 04 Feb 2022, MACD is suggesting that INJ is regaining upward momentum in the past week.
4.3. Bollinger Band
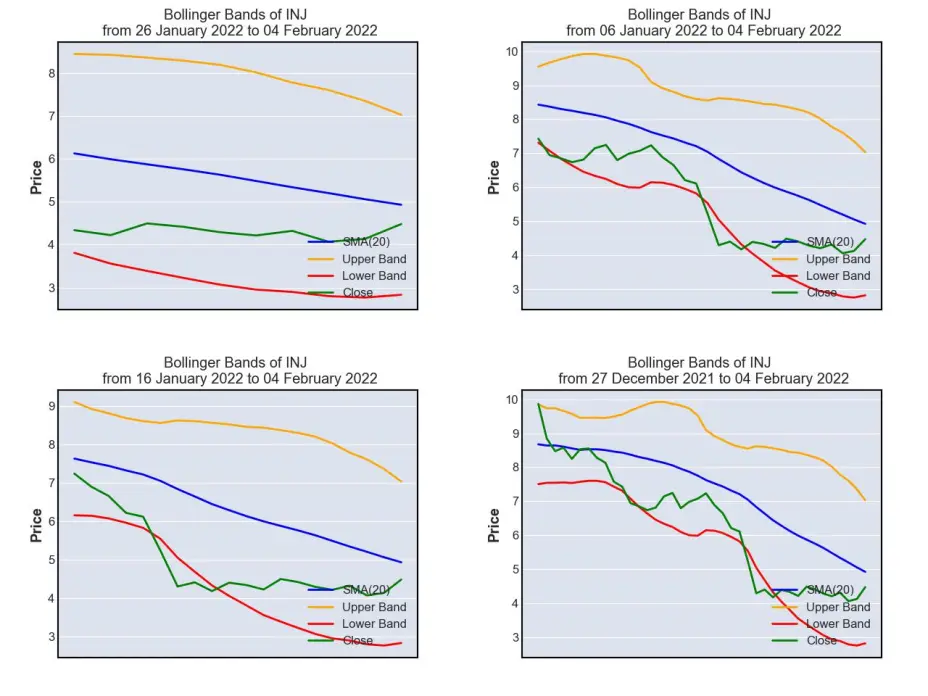
Bollinger band is often being used by mean-reversion trader as a gauge to assess how undervalued or overvalued an asset is. Its chart made up of 4 lines, namely:
- SMA (20) (blue line), which is the 20-day simple moving average price of INJ
- Upper Band (orange line), which is computed by adding 2 standard deviations of INJ on SMA (20)
- Lower Band (red line) , which is computed by subtracting 2 standard deviations of INJ from SMA (20)
- Close (green line), which is the daily closing price of INJ
Whenever close line (green) touches the lower band (red), it indicates that INJ is corrected too much and is being traded at an undervalued level, representing a 'buy' opportunity. On the other hand, whenever close line (green) touches the upper band (orange), it indicates that INJ is gaining too much momentum and is being traded at an overvalued level, thus indicating a 'sell' opportunity.
As of 04 Feb 2022, Bollinger Band is suggesting that INJ is now trading within an undervalued territory.
4.4. Relative Strength Index (RSI)
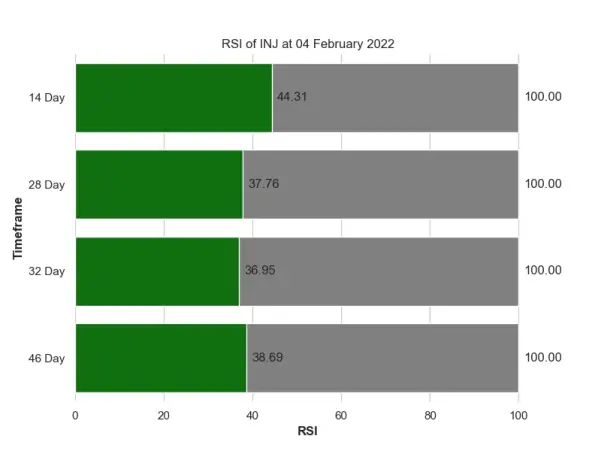
Just like Bollinger Band, Relative Strength Index is often being used by mean-reversion trader as a gauge to assess how undervalued or overvalued an asset is. There are 2 psychological levels, i.e. 30 and 70 in RSI. Whenever the RSI reaches 30, it indicates that INJ is corrected too much and is being traded at an undervalued level, representing a 'buy' opportunity. On the other hand, whenever RSI reaches 70, it indicates that INJ is gaining too much momentum and is being traded at an overvalued level, thus indicating a 'sell' opportunity.
As of 04 Feb 2022, RSI is suggesting that INJ is trading near its support level across all trading windows, an indication of INJ being undervalued.
4.5. Price and Volume Analysis
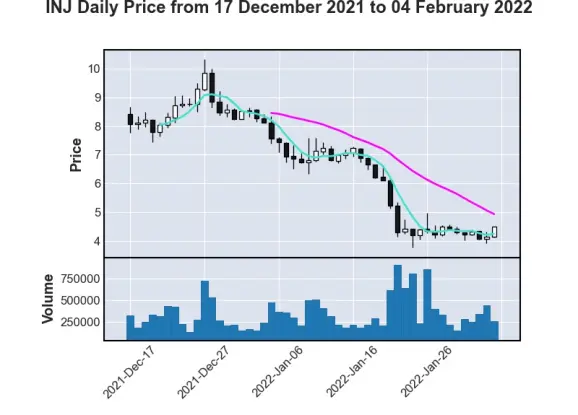
The price and volume chart of INJ above indicates that there are a large trading volumes during mid January this year (around 16 Jan to 23 Jan) when INJ was oversold to its lowest level.
Despite the large trading volumes, INJ price is hardly moving. One of the many interpretations of this scenario is that there may be an equivalent amount of buyers and sellers during this period, where some traders decided to cut loss as INJ has dropped to the same price level as of 1 year ago while some traders took this opportunity to buy the dip.
Based on the technical analysis presented above, quantdoge is bullish on INJ, but I could be wrong, hence please make your careful due diligence before making any financial decision.
5. Injective Risk Profile
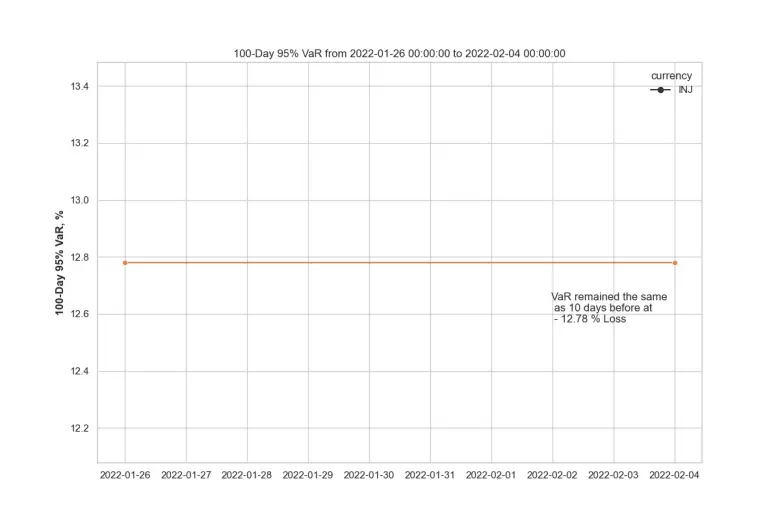
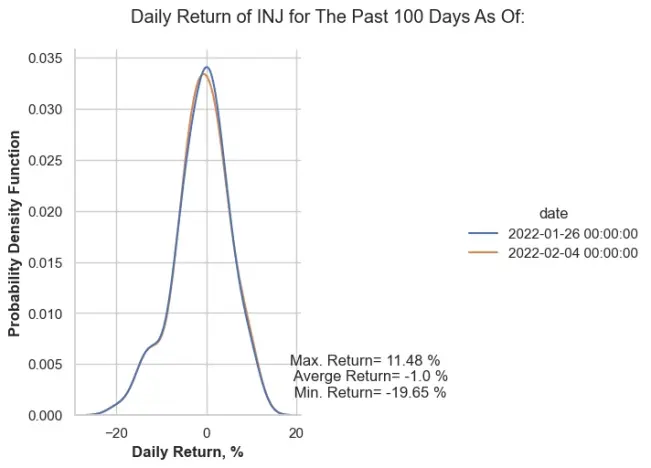
Based on the 100-day 95% historical Value-at-Risk (VaR) profile of Injective defined above, INJ seems to trade at a similar risk level on 04 Feb 2022 as compared to 10 days before on 25 Jan 2022, with its biggest pullback being seen at -19.65% on any single day during the last 100 days. However, I could be wrong, hence please make your careful due diligence before making any financial decision.
6. Google Trends Analytics
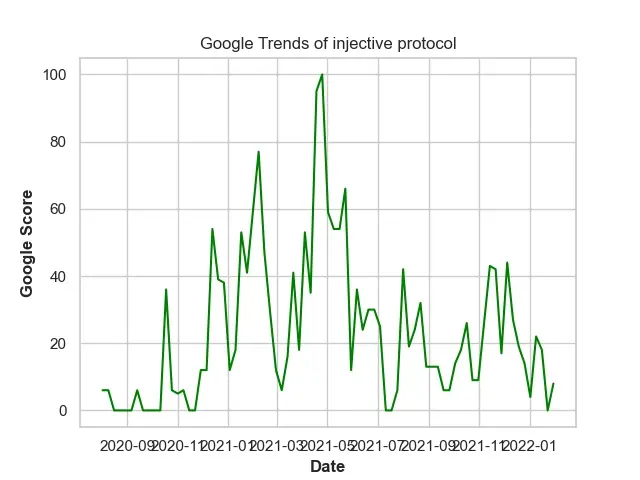
"injective protocol" reached its peak in Google Search on 2021-04-25 with a Google Score of 100
Over the last quarter, "injective protocol" Google Score has decreased 67.5 % from 32.0 to 10.4
Over the last 6 months, "injective protocol" Google Score has decreased 60.0 % from 26.0 to 10.4
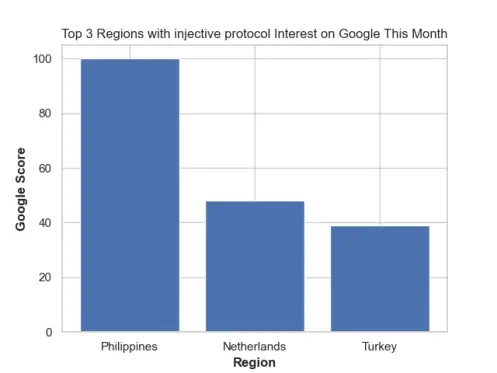
Over the last month, "injective protocol" is most saught after on Google from Philippines, followed by Netherlands and Turkey.
If you like my analysis and articles, please follow me at @quantdoge for daily updates.
Follow My Twitter for daily updates: https://twitter.com/quantdoge






