
Bitcoin Metrics | Market Update | Major Crypto News | NEWBIES lesson of the day: Inflation
 “Me buying the dip.”
Disclaimer: I am not a financial advisor, everything on this report is financial opinion. Please consult your financial advisor before participating in crypto.
I’ve read various reports in the past week, and I wanted to share a few highlights in my newsletter today. These charts aid in formulating an idea of our current market structure. Let us begin by looking at inflation in the US, which saw the Core Inflation Report released this past Tuesday.
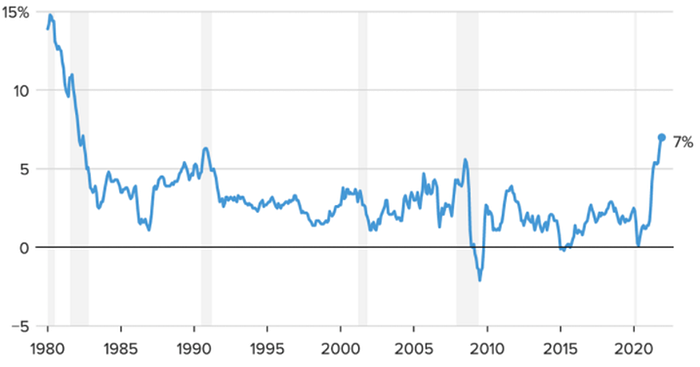
The Core Inflation report from Tuesday preserves the notion of high inflation in the US economy. Of all G20 countries, five countries had worse inflation than the US in the past year. Some analysts predict inflation at ~15%, noting the standards to measure inflation is in constant flux. Considered an inflation and currency debasement hedge, Bitcoin rebounded considerably on the news.
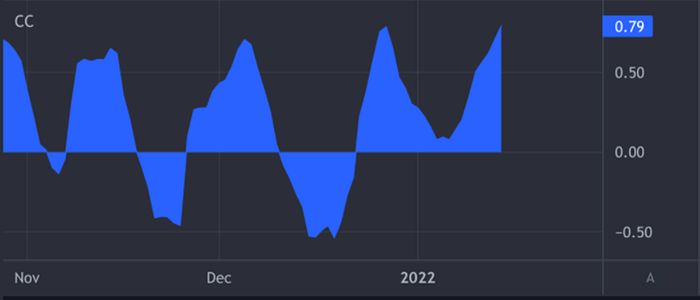
Don’t ever let anyone tell you Bitcoin isn’t correlated to the stock market. Although the metric oscillates according to economic conditions, Bitcoin currently relates highly to the SPX (S&P 500 Index). Of course, an uncorrelated Bitcoin would be ideal, but the recent “risk-off” market conditions have seen a parallel in stocks and Bitcoin. Chart borrowed from the Blockware Intelligence Solutions Newsletter.
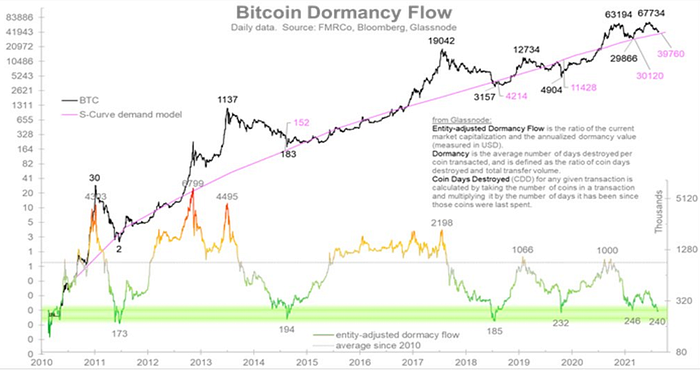
The chart above showcases an encouraging picture for Bitcoin support at the current levels (~42k). The green line below, the dormancy flow has entered a buy zone for Bitcoin for only the sixth time in Bitcoin history. Bitcoin began significant runs after the previous five buy zones. The dormancy flow compares the amount of coin destruction to Bitcoin’s market cap. The chart originates from a recent Fidelity report on Bitcoin
Analysis
The reports and charts above are convincing in that Bitcoin has a high likelihood of holding 42–40k support. Demand for Bitcoin needs to increase for a solid rebound to occur, but the notion of Bitcoin entering an accumulation zone seems strong.
The broader crypto market has been looking healthy in the past seven days, seeing strong projects exhibiting solid gains. Fundamentally, the evidence further supports Bitcoin metrics mentioned earlier.
Consider accumulating or dollar-cost averaging with the combination of fearful markets and metrics supporting strength.
Probabilities over absolutes
Market Update
Bitcoin (BTC) has steadied alongside the stock market and continues to hover near the 42k support zone. Bitcoin quietly climbed 1.21%.
Oasis (ROSE) climbed 13% today after news of yet another
successful investment round that saw the project collected $150 million yesterday. ROSE is up 87% in four days.
Dogecoin (DOGE) jumped 13.5% after Tesla announced the company would begin accepting payments in DOGE. In addition, DOGE set up a roadmap for 2022, a first for the chain.
Notable Gainers
- FTT 44.30 +8%
- SCRT 8.18 +24%
- LTC 144.00 +7%
- METIS 262.00 +27%
Bitcoin Fear and Greed Index: 21 Extreme Fear
“Bitcoin” Google Trends: 33
Bitcoin Options Max Pain (Jan 20): 48K
How to use The Fear and Greed Index for investing
Major Crypto News
- USDC’s supply on Ethereum surpasses USDT’s for the first time. Very positive news considering Tether’s centralized and funded nature (USDT).
- Rio de Janeiro mayor plans to invest 1% of the city’s treasury into crypto.
- FTX launches a $2 billion venture fund, hires Lightspeed exec to lead.
- Tesla is testing a payment option for Dogecoin (DOGE).
- Mark Cuban’s investment allocation is 80% crypto.
“[Cryptocurrency is] hard to understand and it’s a hassle, but ten years from now, these applications — there’s going to be those that succeed — that’ll create its own economy, and just like the Internet days, it’ll be the younger generation that figures it out first and is innovative.”
- Mark Cuban
Notable Events
- Raoul Pal’s 2022 Crypto Forecast interview
- Stellar (XLM) AQUA Airdrop Snapshot on Jan 17
- Near Protocol (NEAR) launches stake farming.
NEWBIES lesson of the day
Inflation
The financial definition of inflation is “the decline of purchasing power of a given currency over time.” In other words, currencies lose value over time.
A basket of goods and services considered essential for living is tracked over time to measure inflation.
As the money supply inevitably increases over time, the goods and services will become more expensive. This is because more money in the economy equals a higher cost of goods/services.
A country’s economic model, money supply, and other factors will ultimately decide inflation rates.
The US has a goal to maintain inflation near +2% a year. The chart above showcases that the US has yearly inflation of 7%, the highest in 40 years. The Federal Reserve, which controls the money supply for the US government, printed 40% of all USD in existence in 2021.
Some countries whose economies have failed have seen inflation as high as +1000% in one year. For example, the Turkish Lira collapsed in late 2021 and saw inflation reach +36% in a matter of weeks.
Ultimately a country with high inflation will suffer; the everyday citizens usually take the worst hit as food prices escalate out of control.
Thanks for reading fam, enjoy the weekend!
 Gabi
Gabi
Follow me on Twitter and Medium or subscribe to this FREE daily newsletter on Substack
To reap the benefits of this newsletter it’s recommended to read it every day to stay in tune with crypto markets. It will put the reader in the 2% of market participates that are well informed. The reader will begin to see opportunities that are not apparent to most and will open up many more. The newsletter is composed of many hours of daily research in charts, on-chain metrics, news, and developing narratives condensed to a 5-minute update. It’s my contribution to a crypto community that has contributed so much to me.


