Right now, at this moment, BTC is at a turning point... because while we're in a long-term uptrend... well, this month of August is hinting at the possible beginning of a trend change.
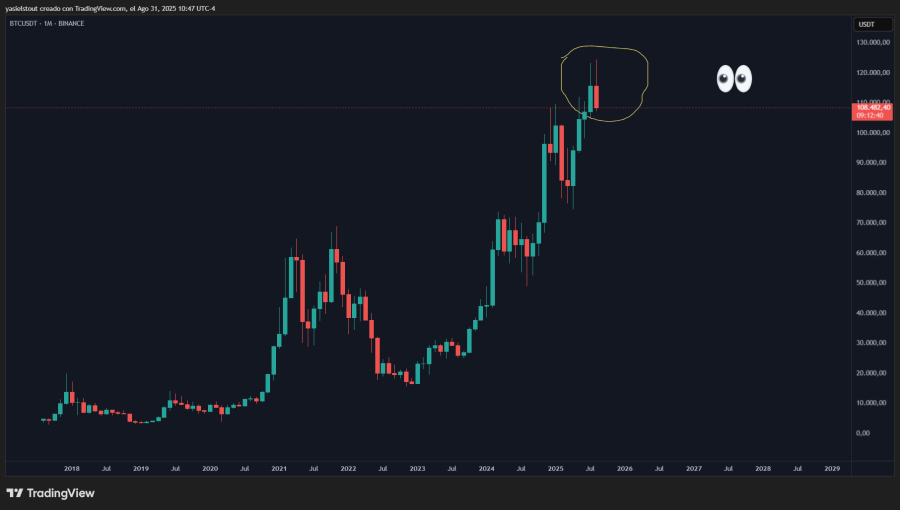
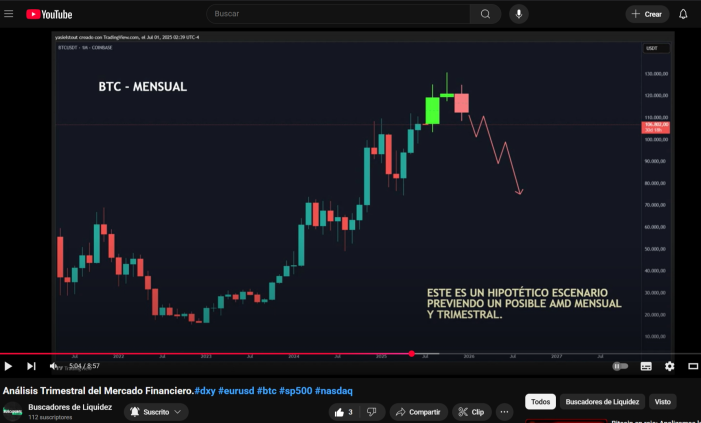
These are signs that shouldn't be overlooked... Especially since it was one of the projections we analyzed on July 1st in the quarterly analysis. ( )
There we said that if August swept away July's higher Liquidity, then we could be facing an imminent quarterly AMD... and depending on how September ends, the movement could extend a little further into the last quarter of the year.
So, in this analysis, we're going to identify key levels of high (monthly) temporality... Because at those levels, what we'll do is wait for confirmations of a reversal or continuation, for both longs and shorts.
...And we'll use the Daily timeframe to look for entry confirmations.
Working on the strategy this way will help us greatly reduce the noise generated in lower timeframes... And this will definitely protect us in the midst of a complicated scenario, such as what could be the beginning of a trend reversal... Where the signals are there, visible to everyone, but have not yet been confirmed.
So, without further ado, these are the levels to watch over the next 30 days.
First, there's the opening for this month of September.
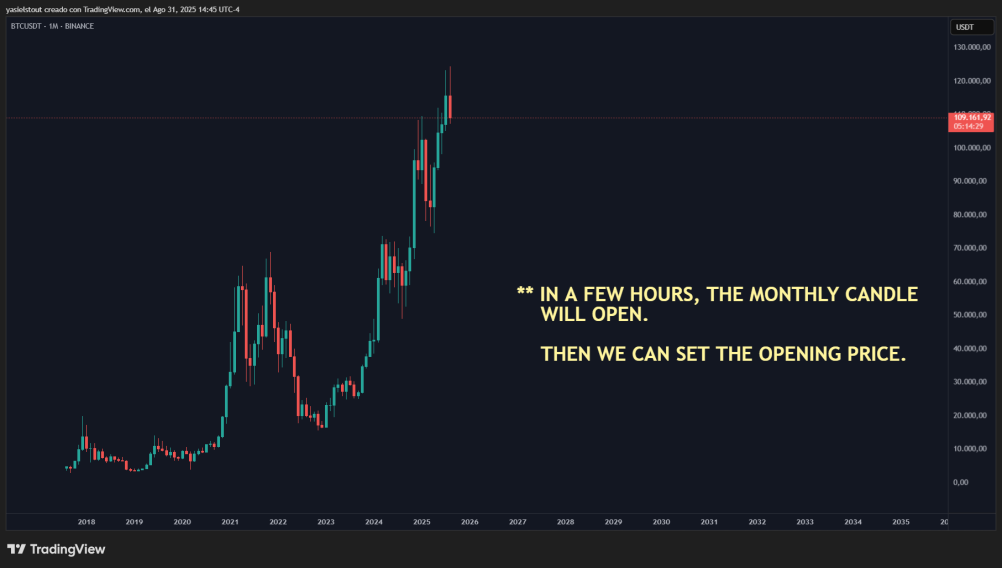
This opening level will be an area of institutional liquidity... We'll use this level to prioritize buying when we're below it... and selling when we're above it.
In addition, we'll also use it as a target to close positions.
Right now, it's not visible because there are still a few hours until the monthly candle opens... but when this happens, we'll be able to identify and mark the exact price.
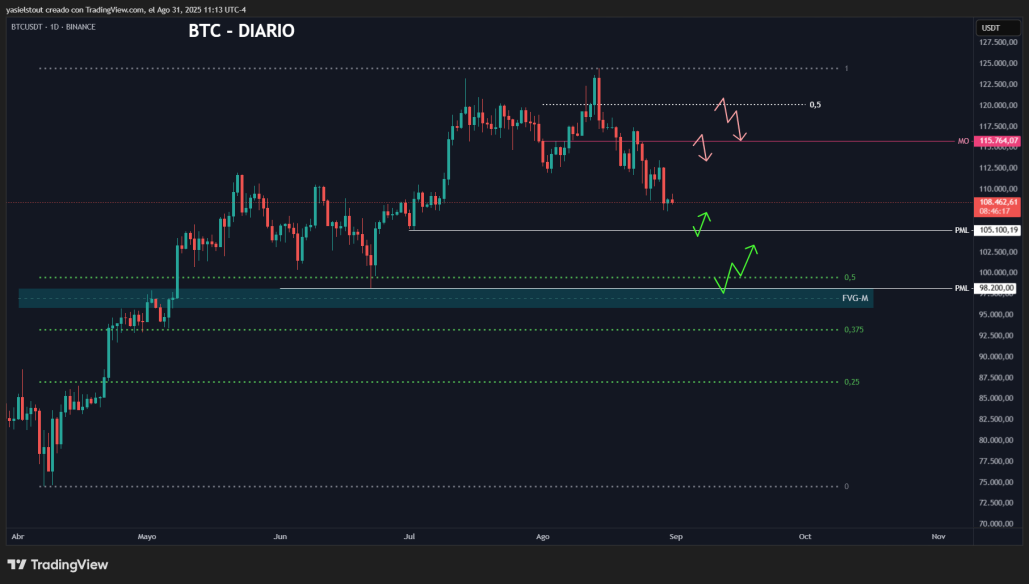
Secondly, I'll be monitoring the July and June price lows because if the bearish scenario is confirmed, these levels will be the main targets. But they're also levels we can use to look for buy confirmations for intraday trades.
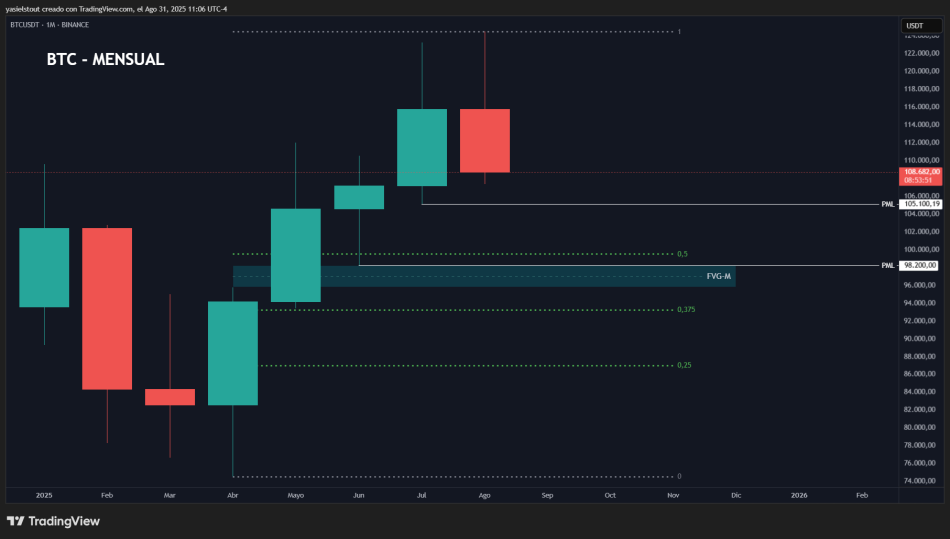
... Especially the June low, because it coincides with the 50% of the range and the only monthly imbalance in this range. Take careful note of this level, because it could give us the opportunity to execute a very good trade.
And thirdly, I'll be watching the August monthly open at 115,750 and the 50% of the August monthly wick, also at 120,000. This will be the area to look for sell confirmations.

We have to wait for the price to reach there and see what reaction it will have. But being able to identify these zones of institutional liquidity puts us in an advantageous position because we know that outside of these institutional levels, we shouldn't make definitive decisions, because we'll fall prey to noise. And it's best to stay away from these scenarios where uncertainty prevails.
For now, I'll leave it at that... There's no point in speculating on price in a scenario of a potential trend reversal. It can be very dangerous to become biased or to rely on directionality when the signals suggest one thing but we don't yet have confirmation.
On the other hand, if we are patient and, instead of trying to guess, react once the price shows its true value... Not only will we be protecting ourselves against potential traps, but we'll also be able to know when to act when we have a true probabilistic advantage... And that, that's all we need to survive another day in this wild market.
.
.
... *UPDATE: 9/1/2025 (00:40h NY)
The September monthly open was at 108,246 (Binance chart), and the August low was at 107,350.
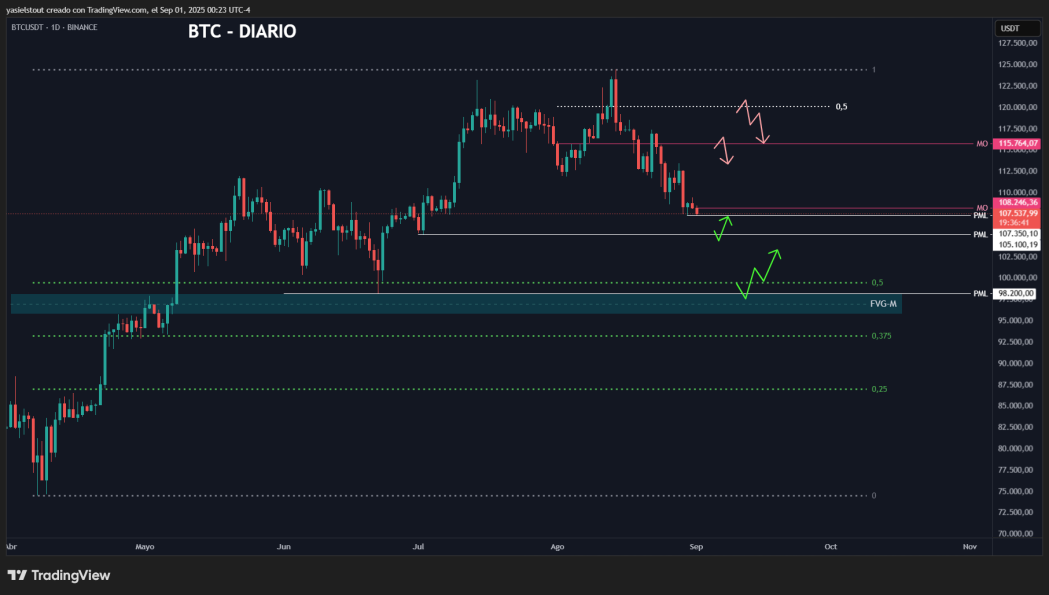
It's possible to see a price reaction when it takes on that lower liquidity from August, but it would only be to take advantage of a short-term movement.
I still maintain the July and June lows as the most important liquidity.
.
.
-------------------------------
You can watch this analysis on YouTube:
-------------------------------
Save this article because I'll be updating it whenever necessary 
-------------------------------
Follow every trade I make in the market in real time: https://acortar.link/CopyTradingBuscadores
-------------------------------