
Most traders chase profits. Consistently successful traders chase something else entirely: measurable improvement.
The difference sounds subtle, but it changes everything about how a trader operates day to day. A trader focused purely on profit reacts emotionally to every green or red number on the screen. A trader focused on trading performance reviews process, checks whether their edge is holding up, and treats each trade as a data point rather than a verdict on their skill.
This distinction matters because markets are probabilistic. Even a strategy with a genuine statistical edge will produce losing trades, losing days, and losing weeks. If a trader only tracks profit, a string of losses feels like failure. If a trader tracks performance — win rate, risk-adjusted returns, execution quality, psychological consistency — the same losing streak becomes information, not a crisis.
This guide is built for traders who want to move past guesswork. It covers what trading performance actually means, which metrics professionals rely on, how to run daily, weekly, and monthly performance reviews, and how AI-powered analysis is changing the way traders evaluate their own historical data. Nothing in this guide predicts markets, recommends trades, or promises profit. It is a framework for measurement and improvement — the two things that separate traders who last from traders who don't.
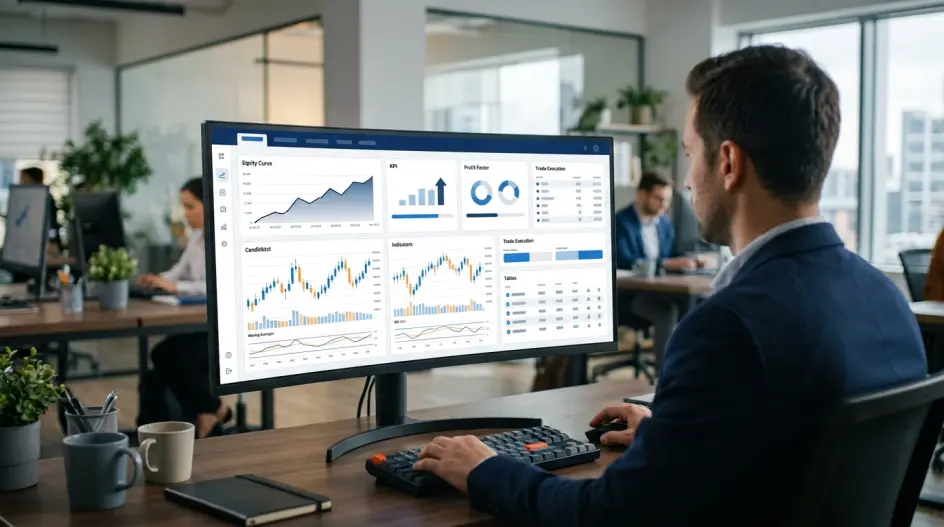
What Is Trading Performance?
Trading performance refers to the measurable quality of a trader's decision-making and execution over time, evaluated through objective statistics rather than short-term profit or loss.
It includes factors such as:
- How often a strategy wins versus loses (win rate)
- How much is gained relative to how much is risked (risk-reward and expectancy)
- How consistent execution is across similar setups
- How well risk is controlled during losing periods (drawdown)
- How psychological state affects decision quality over time
A trader can have a profitable month and still have poor trading performance — for example, if one oversized, lucky trade masked a pattern of undisciplined entries. Conversely, a trader can have a losing month with strong underlying performance, if losses were small, controlled, and consistent with a tested strategy that is simply going through a statistically normal drawdown.
A Simple Example
Consider two traders who both finish the month up 4%.
Trader A took 40 trades, followed their plan on 38 of them, kept losses small and consistent, and had one outsized winner that boosted the month.
Trader B took 12 trades, abandoned their stop-loss rules on four of them, and got bailed out by a single large move that happened to go their way.
Both ended the month with identical returns. Only one of them has a trading process that's likely to hold up over the next 100 trades. This is why professional traders, prop firms, and institutional desks evaluate performance using statistics — not just the account balance.
Why Performance Matters More Than Individual Trades
Any single trade can be a loser even with a perfect strategy and perfect execution, simply due to randomness. Judging a strategy — or yourself — based on one trade, or even one week, is statistically unreliable.
Performance measurement solves this by looking at aggregated data across dozens or hundreds of trades, where the underlying edge (or lack of one) becomes visible. This is the same principle used in behavioral finance and quantitative research: individual outcomes are noisy, but large samples reveal the truth.
Why Most Traders Measure the Wrong Things
Ask most retail traders how their strategy is performing, and they'll answer with a single number: their profit or loss. That answer, on its own, hides more than it reveals.
Only Checking Profit
Profit is an outcome, not a process metric. It's affected by position sizing, market volatility, and luck, in addition to skill. A trader who only checks P&L has no way to tell whether a good month was earned or accidental.
Ignoring Psychology
Emotional state directly affects execution quality. Traders who don't track psychology — stress, fatigue, revenge trading, overconfidence after wins — often repeat the same behavioral mistakes without realizing a pattern exists.
Ignoring Consistency
A strategy that wins big occasionally but loses discipline in between isn't reliable, even if it's net profitable. Consistency — how closely actual execution matches the tested plan — is one of the strongest predictors of long-term survival in trading.
Ignoring Execution Quality
Two trades with the same entry signal can have very different outcomes depending on execution: slippage, timing, position sizing, and whether stop-losses were honored. Traders who never review execution quality can't distinguish a strategy problem from an execution problem.
Ignoring Historical Data
Perhaps the biggest gap: most retail traders don't keep structured historical records at all. Without a trading journal or performance log, there's no dataset to analyze, which means every review is based on memory — and memory is notoriously biased toward recent, emotionally charged trades rather than the full picture.
The Most Important Trading Performance Metrics
Professional and institutional traders rely on a consistent set of statistics to evaluate performance objectively. Here are the metrics that matter most.
Win Rate
The percentage of trades that close profitably. Win rate alone is misleading — a strategy can have a 30% win rate and still be highly profitable if winners are large relative to losers.
Profit Factor
Calculated as gross profit divided by gross loss. A profit factor above 1.0 means the strategy is net profitable; professional traders typically look for a profit factor comfortably above 1.5 across a large sample size.
Average Risk-Reward (RR)
The average ratio between what's risked and what's gained per trade. This metric, combined with win rate, determines whether a strategy has positive expectancy.
Expectancy
Expectancy answers the core question: "On average, how much do I make or lose per trade?" It's calculated using win rate, average win, and average loss together, and it's arguably the single most important performance metric because it summarizes the strategy's edge in one number.
Maximum Drawdown
The largest peak-to-trough decline in account equity. Maximum drawdown reveals how much risk exposure a strategy carries and how much psychological pressure a trader needs to withstand during losing periods.
Average Win / Average Loss
Tracking these separately, rather than as a blended number, shows whether a trader is cutting losses appropriately and letting winners run — or doing the opposite.
Net Profit
Total gain or loss across a defined period. Useful as a headline number, but only meaningful when reviewed alongside the metrics above.
Holding Time
How long positions are typically held. Sudden changes in holding time can signal a shift in strategy, discipline, or emotional state (for example, holding losers longer than winners).
Trade Frequency
How often trades are placed. A spike in frequency often correlates with overtrading, revenge trading, or boredom-driven entries outside the tested strategy.
Monthly Growth
Percentage account growth per month, tracked over time to identify trends, seasonality, or strategy decay.
Largest Win / Largest Loss
Outlier trades that can distort other averages. Reviewing these separately helps identify whether performance is being driven by a handful of extreme trades rather than consistent edge.
Consistency Score
A composite measure — often used in modern trading dashboards — that reflects how closely actual trades match a trader's stated rules and plan.
Psychology Score
A qualitative-to-quantitative measure that tracks emotional state across trades (confidence, stress, discipline), often derived from journal entries and self-reported mood tags.

Daily Performance Review
Professional traders treat the daily review as non-negotiable, regardless of whether the day was profitable. A structured daily review typically covers:
- Trades — What was entered, why, and whether it matched the plan.
- Emotions — What emotional state was present before, during, and after each trade.
- Risk — Whether position sizing and stop-losses matched the pre-defined risk plan.
- Execution — Whether entries and exits were timed as intended, or affected by hesitation, slippage, or impulsiveness.
- Journal Notes — A short written reflection capturing lessons, mistakes, or patterns worth revisiting later.
The daily review doesn't need to take more than 10–15 minutes, but skipping it — especially after a losing day — is one of the most common reasons traders repeat avoidable mistakes.
Weekly Performance Review
A weekly review zooms out from individual trades to identify patterns across the full week.
- Best Setups — Which specific setups or conditions produced the strongest results
- Worst Setups — Which conditions consistently underperformed and may need to be filtered out
- Winning Habits — Behaviors that correlated with better decision-making
- Mistakes — Recurring errors, whether in execution, risk sizing, or emotional control
- Risk Exposure — Whether total exposure across the week stayed within planned limits
- Goal Tracking — Progress against weekly targets, whether performance-based (e.g., following the plan on 90%+ of trades) or statistical (e.g., maintaining expectancy above a threshold)
Monthly Performance Analysis
Monthly reviews are where longer-term trends become visible that daily or weekly data can't reveal on their own.
- Growth — Net account growth, and whether it's trending consistently or driven by outlier trades
- Drawdown — How deep and how long drawdown periods lasted during the month
- Assets — Which instruments or markets performed best and worst
- Strategies — Performance broken down by individual strategy or setup type
- Psychology Trends — Whether emotional state improved, worsened, or stayed stable across the month
- Consistency — How closely the month's trades matched the trader's documented plan
A monthly review is also the appropriate time to decide whether a strategy needs adjustment — a decision that should be based on statistically meaningful sample sizes, not a handful of trades.
How AI Improves Trading Performance
Artificial intelligence has become a practical tool for analyzing historical trading data at a scale that would take a human hours to replicate manually. It's important to be precise about what AI does — and doesn't — do in this context.
Pattern Detection
AI models can scan hundreds or thousands of historical trades to identify patterns a trader might miss, such as a specific time of day, setup type, or market condition that consistently correlates with underperformance.
Historical Analysis
Rather than reviewing spreadsheets manually, AI-powered journals can summarize months of trading history into digestible reports, highlighting trends in win rate, expectancy, and consistency over time.
Behavior Analysis
By analyzing journal entries, trade timing, and position sizing together, AI can flag behavioral patterns — such as increasing position size after a losing streak, a common sign of revenge trading.
Psychology Summaries
AI can aggregate mood tags, journal notes, and trade outcomes into a psychology trend report, helping traders see how emotional state correlates with performance over weeks or months.
Execution Consistency
AI tools can compare actual trade execution against a trader's documented rules, flagging deviations that might otherwise go unnoticed.
Asset Performance
Breaking down performance by individual asset or instrument helps identify where a trader's edge is strongest — and where it may not exist at all.
Strategy Performance
Similarly, AI can separate performance by strategy type, making it possible to see which specific approaches are statistically working and which are dragging down overall results.
What AI Does Not Do
To be unambiguous: AI historical analysis tools review past, completed trade data only. They do not predict future price movement, generate buy or sell signals, or provide financial advice. Any tool or platform that analyzes trading performance should be understood strictly as a historical review and pattern-recognition tool, not a forecasting or advisory service. Traders remain fully responsible for their own trading decisions.
Common Performance Mistakes
Even experienced traders fall into a small set of recurring performance traps.
- Changing Strategy Too Often — Abandoning a strategy after a normal losing streak, before it has had a statistically meaningful sample size to prove or disprove its edge.
- Ignoring Data — Making decisions based on gut feeling or memory rather than reviewing actual historical statistics.
- Overtrading — Increasing trade frequency beyond the tested strategy, often driven by boredom, impatience, or the urge to "make back" a loss.
- Poor Risk Management — Sizing positions inconsistently, or risking a disproportionate amount of capital on a single trade.
- No Journal — Without a structured record, there's no reliable dataset to review, which makes genuine improvement almost impossible to measure.
- No Review Process — Even traders who keep a journal often stop reviewing it consistently, which limits the value of the data being collected.
Each of these mistakes shares a common thread: they replace structured, data-driven decision-making with reactive, emotion-driven decision-making.
How DailyTraderz Helps Improve Trading Performance
Tracking all of the metrics and review habits covered in this guide manually — across a spreadsheet, a notebook, and memory — is possible, but it's time-consuming and prone to gaps. This is the problem that dedicated trading performance platforms like DailyTraderz are built to solve.
At its core, DailyTraderz centers around a structured trading journal, where every trade, along with notes on emotional state and execution quality, is logged in one place rather than scattered across tools. From that data, the platform's AI Analysis and AI Coach features summarize patterns across a trader's historical performance — surfacing recurring mistakes, behavioral trends, and areas of consistency without offering predictions about future price action.
The Strategy Playbook allows traders to document their rules for each setup and then compare documented rules against actual historical execution, which directly supports the kind of trade review process professional traders rely on. Asset Performance breaks results down by individual instrument, while the Trade Risk Planner helps traders define position sizing and risk parameters before entering a trade, reinforcing the risk management principles covered earlier in this guide.
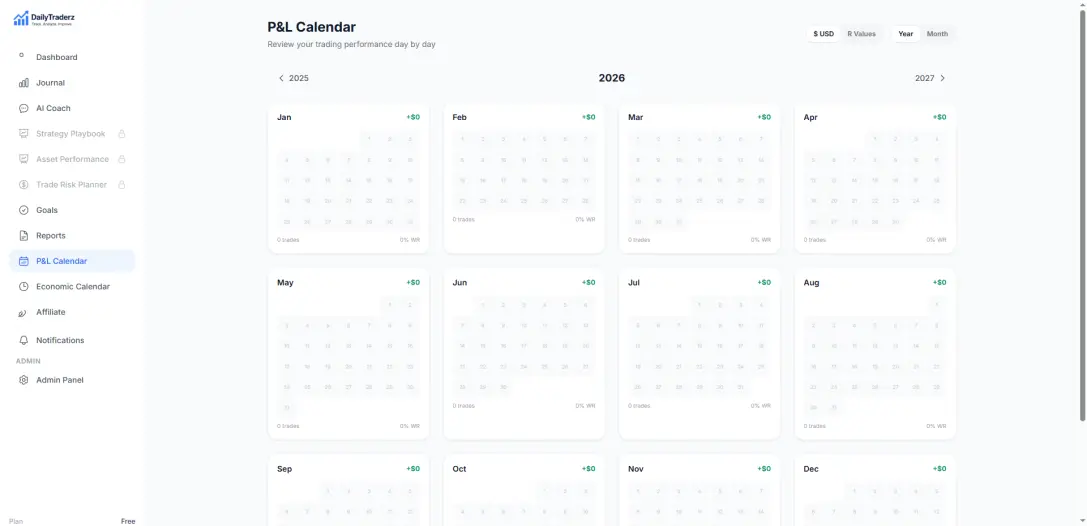
For ongoing review, Goals, Reports, and the P&L Calendar give traders a structured way to run the daily, weekly, and monthly reviews described above, while the central Performance Dashboard consolidates win rate, profit factor, expectancy, drawdown, and consistency into a single view. For traders who want a deeper technical breakdown of how these analytics work together, DailyTraderz's guide to trading analytics covers the methodology in more depth, and this independent analysis on trading analytics as a discipline offers another perspective on how structured data review supports long-term consistency.
Every feature is built around the same principle outlined throughout this guide: performance is measured and improved through historical review, not prediction. DailyTraderz does not generate trade signals, does not forecast market direction, and does not provide financial advice — it organizes and analyzes a trader's own historical data so they can make better-informed decisions about their own process. Traders interested in how these tools fit together can review the platform's features and pricing pages for more detail.
Frequently Asked Questions
1. What is trading performance? Trading performance is the measurable quality of a trader's decisions and execution over time, evaluated through statistics like win rate, expectancy, and drawdown rather than short-term profit alone.
2. Why is trading performance more important than profit? Profit can be influenced by luck or oversized outlier trades, while performance metrics reveal whether a strategy has a genuine, repeatable statistical edge.
3. What is a good win rate in trading? There's no universal "good" win rate — a 40% win rate can be highly profitable with a strong risk-reward ratio, while a 70% win rate can still lose money if losses are disproportionately large.
4. What is profit factor and why does it matter? Profit factor is gross profit divided by gross loss. It shows whether a strategy is net profitable and by how much, independent of win rate alone.
5. What is a good profit factor for a trading strategy? Many professional traders look for a profit factor above 1.5 across a statistically meaningful number of trades, though acceptable thresholds vary by strategy and risk tolerance.
6. What is trading expectancy? Expectancy is the average amount a trader can expect to gain or lose per trade, calculated from win rate combined with average win and average loss size.
7. How is maximum drawdown calculated? Maximum drawdown is the largest percentage decline from a peak account value to the lowest point that follows before a new peak is reached.
8. Why does maximum drawdown matter? It reflects both financial risk and psychological pressure — a strategy with deep drawdowns can be statistically profitable but extremely difficult to hold through psychologically.
9. What is a trading journal? A trading journal is a structured record of trades, including entry and exit details, reasoning, risk parameters, and often emotional state, used to review and improve performance over time.
10. Why do professional traders keep a trading journal? Because memory is unreliable and biased toward recent or emotionally significant trades. A journal provides objective, reviewable data across the full trading history.
11. What should a trading journal include? At minimum: entry and exit price, position size, strategy or setup used, outcome, and a note on execution quality and emotional state during the trade.
12. What is a trading dashboard? A trading dashboard is a consolidated view of key performance metrics — such as win rate, profit factor, expectancy, and drawdown — typically updated automatically from journaled trade data.
13. How often should traders review their performance? Most professional traders review performance daily for immediate lessons, weekly for pattern recognition, and monthly for longer-term strategic decisions.
14. What is a consistency score in trading? A consistency score measures how closely a trader's actual executed trades match their documented strategy rules, used to identify discipline gaps.
15. What is a psychology score in trading? A psychology score aggregates self-reported emotional states and behavioral patterns across trades to identify how mental state correlates with performance.
16. Can AI predict market movements? No. Reputable AI trading performance tools analyze historical, completed trade data to identify patterns and behaviors — they do not forecast future price action.
17. Does AI trading analysis provide financial advice? No. AI-powered performance tools are educational and analytical in nature. They summarize historical data; they do not recommend buying, selling, or holding any asset.
18. How does AI help identify trading mistakes? By analyzing large volumes of historical trades and journal notes, AI can surface recurring patterns — such as specific setups, times, or emotional states associated with underperformance — that are difficult to spot manually.
19. What is overtrading? Overtrading refers to placing trades more frequently than a tested strategy calls for, often driven by boredom, impatience, or the desire to recover recent losses.
20. What is revenge trading? Revenge trading is the tendency to increase position size or trade frequency immediately after a loss, driven by emotion rather than a documented strategy.
21. How does risk management affect trading performance? Consistent risk management — appropriate position sizing and honored stop-losses — directly affects drawdown, expectancy, and the ability to survive losing streaks long enough for a strategy's edge to play out.
22. What is average risk-reward ratio? Average risk-reward ratio compares the typical amount risked per trade to the typical amount gained, and is a key input into expectancy calculations.
23. How many trades are needed for meaningful performance data? While there's no fixed number, many traders and analysts consider at least 30–100 trades necessary before statistics like win rate and expectancy become reasonably reliable.
24. What is holding time and why track it? Holding time is the duration a position stays open. Sudden shifts in holding time can indicate strategy drift or emotional decision-making, such as holding losing trades longer than winners.
25. What is the difference between trade frequency and overtrading? Trade frequency is simply how often trades are placed; overtrading specifically refers to frequency that exceeds what a tested strategy or risk plan calls for.
26. How do professional traders review losing trades? By evaluating whether the loss occurred within the bounds of the documented strategy and risk plan, distinguishing "planned losses" from execution or discipline failures.
27. What is asset performance analysis? Asset performance analysis breaks down trading statistics by individual instrument or market, revealing where a trader's edge is strongest or weakest.
28. What is strategy performance analysis? Strategy performance analysis separates results by individual trading strategy or setup type, helping identify which approaches are statistically working.
29. Should traders change their strategy after a losing week? Generally, one losing week is not statistically significant enough to justify a strategy change; professional traders evaluate performance over larger sample sizes before making structural adjustments.
30. What is a P&L calendar? A P&L calendar is a visual, date-based view of daily trading results, often used to spot patterns tied to specific days, weeks, or market conditions.
31. How does psychology affect trading performance? Emotional state influences decision quality, risk tolerance, and discipline. Tracking psychology alongside trade outcomes helps identify when mental state — not strategy — is driving poor results.
32. What is the difference between a trading journal and a trading dashboard? A trading journal is where trade-level data and notes are recorded; a dashboard aggregates that data into summarized metrics and visualizations for review.
33. Can beginners benefit from tracking trading performance metrics? Yes. Beginners benefit significantly from performance tracking, since it replaces emotional self-assessment with objective data early in their development as traders.
34. What role does the CFTC or FINRA play in trading education? Regulatory bodies like the CFTC and FINRA publish investor education resources on risk disclosure, market structure, and responsible trading practices, which serve as authoritative references for traders seeking to understand market mechanics and regulation.
35. Is trading performance analysis the same as financial advice? No. Performance analysis is an educational and statistical review of a trader's own historical activity. It does not constitute, and should not be interpreted as, financial or investment advice.
Conclusion
Trading performance isn't a single number on a screen — it's the sum of a trader's decisions, discipline, and consistency, measured objectively over time. Traders who chase profit alone are at the mercy of variance. Traders who measure win rate, expectancy, drawdown, execution quality, and psychology give themselves something far more valuable: a process they can actually improve.
Daily reviews catch small mistakes before they compound. Weekly reviews reveal patterns across setups and habits. Monthly analysis shows whether a strategy's edge — and a trader's discipline — is holding up over time. AI-powered tools can accelerate this process by analyzing historical data at scale, but their role is strictly analytical: reviewing what already happened, never predicting what will happen next.
Platforms like DailyTraderz exist to make this kind of structured, data-driven review accessible — combining a trading journal, AI-powered analysis, risk planning, and performance dashboards into a single workflow, without ever crossing into market prediction or financial advice. For traders serious about long-term consistency, the path forward isn't a better prediction. It's better measurement.
For additional educational resources on market structure, risk, and responsible trading practices, readers can consult official resources from the CFTC, FINRA, the CFA Institute, CME Group Education, and the NFA.





