Bitcoin, the leader of the cryptocurrency market, has shown an interesting price trend entering January 2025. In this article, we will explore the current technical situation of Bitcoin, analyzing key indicators such as RSI (Relative Strength Index), exponential moving averages (50-day and 200-day EMA), and identifying significant support and resistance levels. Additionally, we will reflect on Bitcoin's position in the current market cycle, comparing it to previous cycles
Technical Analysis
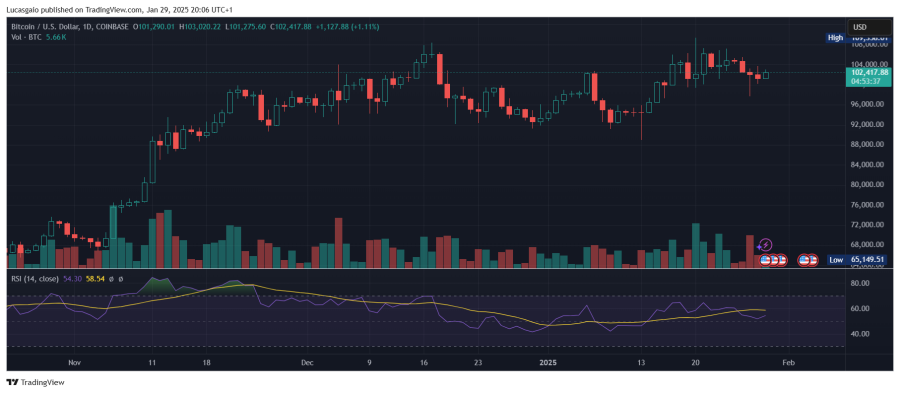
- RSI (14): The RSI (14), a popular momentum oscillator, is a key indicator for determining whether an asset is overbought or oversold. As of January 2025, Bitcoin's RSI is hovering around 55, signaling neutral momentum with a slight bullish trend. This suggests that while there are no obvious signs that Bitcoin is heavily overbought, the indicator is slightly tilted bullish. For context, an RSI below 30 generally indicates an oversold condition, while a value above 70 indicates an overbought condition.
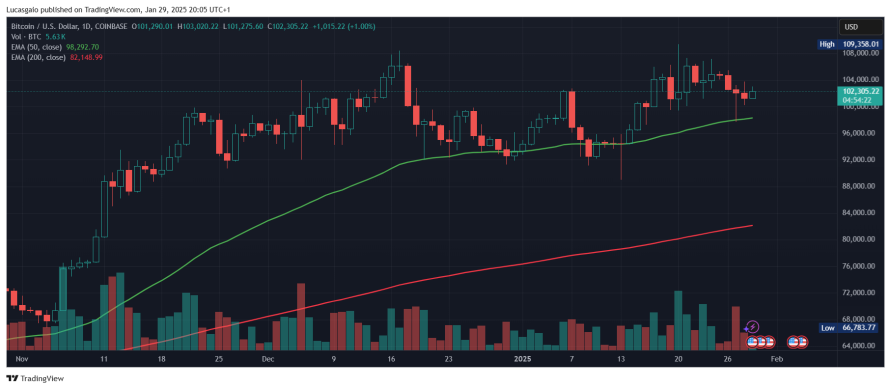
- 50 EMA and 200 EMA: The 50 and 200 day EMAs are two critical levels used to evaluate short-term and long-term trends in the price of Bitcoin. Currently, the 50-day exponential moving average stands at around $98,000, and the price of Bitcoin has only rested at this level for a few days, then using it for momentum that led it to score an ATH.
- 200 EMA: The 200-day exponential moving average, considered the definitive signal for long-term trends, is positioned around $82,000. Even though the price is far from this level, it constitutes a possible first support in the event of a correction.
The relationship between the 50-day EMA and the 200-day EMA is equally significant, as the "golden cross" (when the 50 EMA rises above the 200 EMA) suggests a bullish move, while the "death cross" (when the 50 EMA falls below the 200 EMA) typically signals bearish sentiment. At the moment, these indicators are very far apart, suggesting a bull market condition.
Support and Resistance Levels
- Support: The most immediate support level is found between $91900 and $92500, a significant level we entered in November 2024 after a period of price discovery. A break of this support could pave the way for a further decline towards $82,000 and subsequently towards $72,000.
- Resistance: At the moment the level that can be called "resistance" is located at 109,500 dollars, which is the maximum value reached by Bitcoin. Beyond that price there is no history, therefore one can only theorize that decimal levels correspond to psychological resistance.
Reflection on the current cycle and comparison with previous cycles
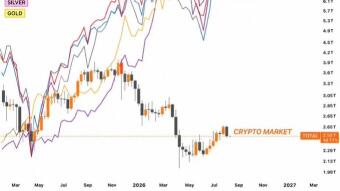
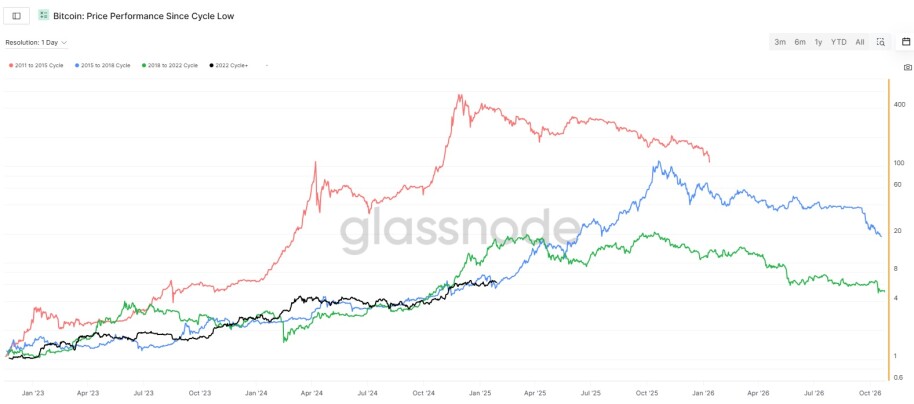
Bitcoin price movements are historically influenced by well-documented 4-year market cycles, which follow a pattern of rapid bullish growth followed by prolonged periods of consolidation or decline. Looking at the attached graph and comparing the current trend with previous cycles, we notice several key points:
-
2011-2015 Cycle: This cycle (red line) was characterized by rapid price growth, followed by a sharp correction and a prolonged bear market. This reflects the early days of Bitcoin, where extreme volatility was more pronounced. Compared to today, the maturity of the market means we are seeing relatively less dramatic swings in both directions.
-
2015-2018 Cycle: This cycle (blue line) saw Bitcoin rise to unprecedented levels in 2017, only to fall sharply in 2018. The similarities to the current cycle are notable, especially in terms of the market peaking and then entering in a more gradual downward trend.
-
2018-2022 Cycle: This cycle (green line) was characterized by relatively more stable growth than previous cycles. The current 2022-2025 cycle (black line) appears to at least initially reflect this pattern.
- 2022-2025 Cycle: The black line in the chart reflects the price of Bitcoin since the last cycle low. You can see how it overlaps almost perfectly with the blue line, especially in the more recent period. Wanting to speculate, therefore, we note how the 2015-2018 cycle saw a sudden increase starting precisely from the phase that is arriving
Glassnode
Final Considerations: How to Position Yourself for the Future
Entering 2025, the price of Bitcoin has always moved within a range between the 50 EMA and $105,000.
Comparing the current cycle to previous ones, we see familiar patterns: rapid expansion followed by periods of cooling. If history is any guide, Bitcoin's long-term trajectory remains bullish, and retracement moments represent potential accumulation opportunities for those taking a multi-year perspective.
While the near-term outlook appears stable, the cyclical nature of Bitcoin suggests that the next bullish phase may be ahead once the market breaks above current resistance levels or establishes a new base. For now, the key is to observe how Bitcoin will react, whether it will correct back to $72,000 or whether it will immediately start a new phase of price discovery.
Read also:
Want to find out more and maybe apply for your Amex Gold or Platinum card?
You can easily do so through my referral [amex.com], which will also guarantee you some exclusive benefits.
If you liked this article, please support me by following me here and on X or DeBank, leave me a like or use one of my referral links below. 👇
➡️ Join Binance, trade and earn.
➡️ Buy a Tesla from the official website.