
Technical Analysis of BTC and ETH
First things first, for me BTC is ‘the’ coin, and ETH may or may not surpass it in the future (post EIP – 1559) but as of today it’s an alt coin in comparison to BTC and will generally follow BTC price movements.
BTC
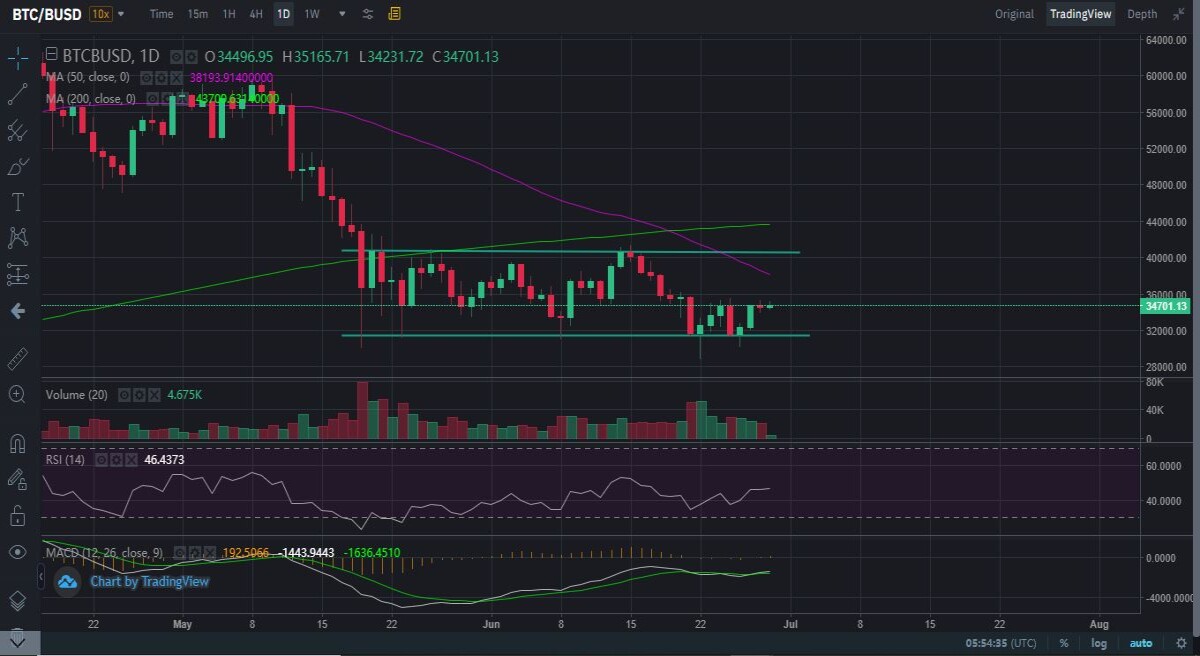
- The much feared death cross (when 50 day – MA crosses down 200 day – MA) is here since 20 June 2021! But it hasn’t wreaked havoc as the general public was predicting. Why’s that? Let’s keep that for another post.
- Price action is trading within a channel, with $ 40,500 acting as resistance and $ 31,500 providing support.
- Since 20 June, MACD line (white) is hugging the signal line (green), and it seems more likely to cross over to continue with the bearish sentiments.
- RSI is at 46 and above the oversold threshold of 30 but for the past week a downtrend can be seen. No sign of RSI divergence, thus no trend reversal is expected soon.
- Volumes, for the past 1 week, have been pretty low and the volume trend has been downwards for more than a week now. The total crypto volume in the past 24 hours has declined by more than 9.5% on day to day basis. Investors should keep that in mind too before taking positions.
Interpretation
- For the time being positions can be taken within the channel. For a long (buy) position one should wait for the price to bounce off the channel support line and the MACD crosses over the signal line.
- Entry: 32,000 (just above channel support to verify any reversals)
- Stop loss: 30,000 (swing low)
- Take Profit: 40,000 (channel resistance)
- These entry and exit points correspond to around 4/1 profit/loss ratio.
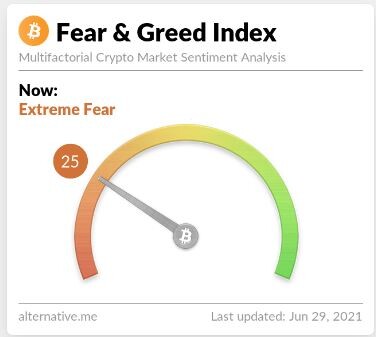
- The entry point of $ 32,000 will be further supported by the data point of ‘fear & greed index’, which at current price of $ 34,701 is at 25 showing extreme fear. At $32,000 levels fear & greed indices would have further declined, which generally is a good indicator of buying opportunity.
ETH

- Price action has created a descending triangle pattern with the lower trendline acting as a support, which can be the continuation of the downtrend with an aggressive move in the next few candles. The 20 day MA is serving as a resistance for the price.
- If the price action breaks down the lower trendline, investors should wait out for few sessions to validate the breakdown.
- Moreover the 20 day MA is below the 50 day MA since the start of June 2021, indicating a prolonged downtrend period.
- Since the start of the June 2021 the MACD is hugging the signal line and the trend is expected to continue till break down occurs.
- RSI is at 45, but still above the oversold threshold, indicating that the prices has room to further decline before it crosses below the 30 threshold. This goes hand in hand with the expected outcome of descending flag pattern.
- The price has seen some upward movement in past few sessions but the corresponding volumes have been very low. Therefore, investors should take this uptrend in price with a pinch of salt.
Interpretation
- It will be wise of the investors to wait out the current scenario and not to take any positions.
- Once the price action is validated, positions can be taken.
- However, for quick scalping purpose long positions can be taken at the lower trendline of the triangle and short positions at the upper trendline. These positions can be closed just before the opposite trendlines.
Note: As I am not a certified financial advisor, along with my analysis, please carry out your own research as well before taking any investment decisions.
Source:
Charts: https://www.binance.com/en/


