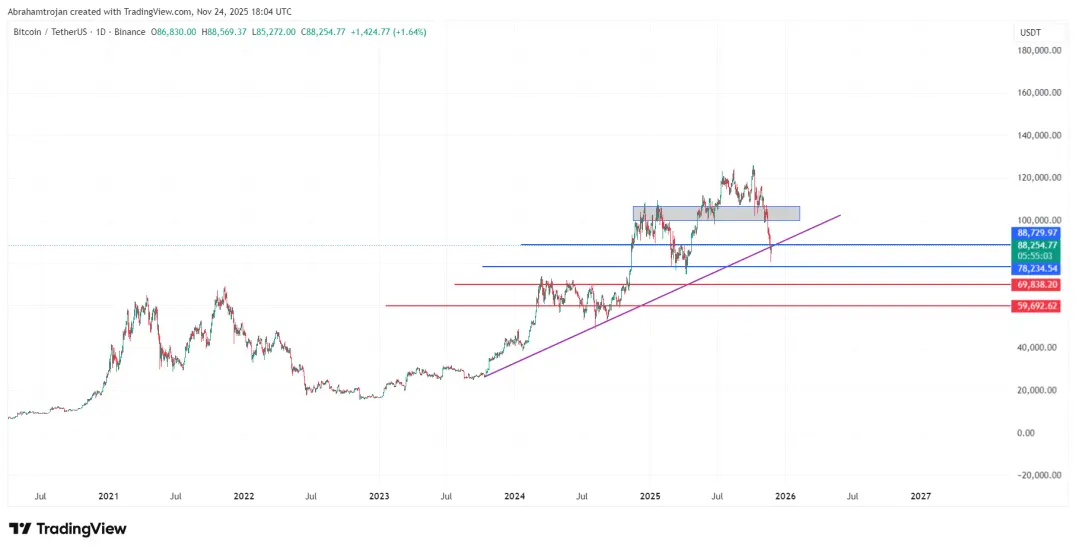
The Bitcoin chart is currently in a consolidation zone, marked by two blue lines in the image. This zone indicates an area where the price has fluctuated multiple times over the past few days, showing a relative balance between supply and demand.
In recent days, we have also witnessed a break of Bitcoin's long-term upward trendline, which is over 770 days old and shown in purple in the image. Breaking this trendline indicates a short-term shift in market sentiment and a potential temporary decrease in buying pressure.
On the other hand, there is a resistance consolidation zone above the current price level, marked with a gray rectangle. This zone represents a level where sellers have historically been strong, and breaking through it would require a significant increase in demand.
Based on the chart behavior, short-term and mid-term upward movements are possible, especially as the price is within the blue consolidation zone. If the chart attempts to rise, surpassing the gray zone above will be challenging and unlikely to succeed, but short-term upward moves can provide good opportunities for taking profits or reducing losses.
Conversely, if the blue zone is lost, the likelihood of a downward movement toward the red zone increases. This zone can serve as the next important support level, and the price reaction there will indicate the market’s next trend.
Overall Conclusion:
-
In the short and mid-term, upward movements are likely, potentially offering opportunities for short-term gains.
-
In the long term, significant corrections and high volatility are possible in the crypto market, so investors should be prepared to face greater risks.
Practical Recommendations:
-
If you have not yet entered the market, entering under these conditions carries high risk and is recommended only for professional traders or those experienced in risk management.
-
If you are already in the market, the current conditions may be the best opportunity to exit or reduce risky positions. Monitoring the gray and blue zones closely will help you make better decisions about staying or exiting.






