"The United States has imposed trade duties ranging from 10 to 50% on more than 180 countries", US President Donald Trump said on the evening of April 2.
After that, the price of bitcoin began to decline sharply, like most other crypto assets.
Analysts assume that the further movement of quotations will depend on geopolitics and retaliatory steps to duties from other states. Despite the fact that bitcoin has long been "advertised" as a hedging instrument against geopolitical and other global risks, now gold traditionally performs this role.
At the beginning of Trump's speech, in which he announced the innovation on April 2, the price of bitcoin began to rise, rising to $88.5 thousand, which was the highest since March 24. However, then the quotes fell to $82.2 thousand (by April 3), having lost about 7% in these few hours.
As of April 3, the price of the main cryptocurrency returned to $83.3 thousand. The total capitalization of the crypto market has fallen by 4% from its peak on March 2, to $2.67 trillion, according to Coinmarketcap.
"The next big step depends on geopolitics, policy changes, and whether traders see bitcoin as risky or defensive," Rachel Lucas, a crypto analyst at BTC Markets, told Bloomberg, noting the importance of the $80k price level.
Some experts do not regard bitcoin at all as a protective asset like gold, the price of which has reached a new historical high against the background of falling cryptocurrencies, rising above the $3,200 mark for the first time in history.
"Cryptocurrencies as a risky asset have typically traded poorly during periods of uncertainty following announcements such as persistently high rates or the imposition of trade duties," said Ava Labs president John Wu.
Joe McCann, founder and CEO of Asymmetric, noted in a conversation with Decrypt that:
"There is very little reason to take risks right now, meaning buying risky assets: cryptocurrencies are under the control of macroeconomic and traditional markets at this stage. <...> Without a clear and precise catalyst, the cryptocurrency will trade like any other risky asset."
As Alexander Blum, CEO of Two Prime Digital Assets, said in a comment for The Block:
Possible catalyst for bitcoin in such economic conditions could be the purchase of the main cryptocurrency in the US national reserve.
According to him, increasing revenue from duties may be a way to purchase more bitcoins:
"Trump has issued a decree to consider the possibility of buying bitcoins if it is done in a budget-neutral manner. Duties, as a new source of federal revenue, may be the solution."
The importance of the $80k price level noted by Lucas coincides with the emerging pattern on the bitcoin chart, called the "death cross", when the short-term moving average price line crosses from top to bottom the long-term average price line.
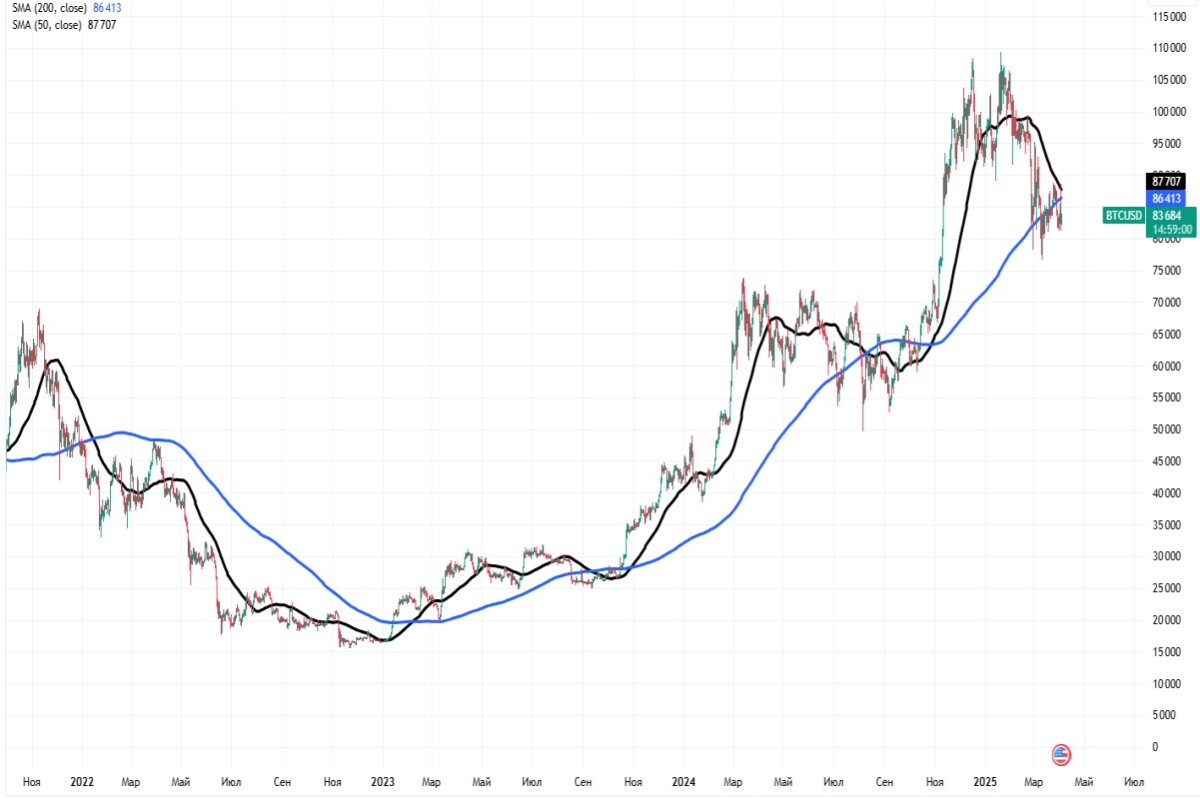
The moving average line refers to the Moving Average (MA) indicator and its modifications, which are plotted on a graph by averaging the price of an asset over a certain period of time. The Simple Moving Average (SMA) is most often used.
The "death cross" is a technical signal that is considered to be a sign of a possible market decline. It occurs when the average price of an asset for a short period (for example, 50 days) falls below the average for a longer period (for example, 200 days). Such an intersection may indicate a change in the downward trend.
The reverse situation is called a "golden cross" — when the short-term moving average crosses the long-term one from the bottom up. On the contrary, this signal is interpreted as a possible beginning of growth.
The 50-day and 200-day moving averages (SMA) are most often used in calculations, but in practice others are also used — for example, for 20, 100 or 150 days.
After the appearance of the "death cross", inexperienced market participants often panic and start selling off assets, increasing the decline. However, such a signal may be followed by a reversal, after which a "golden cross" is already forming on the chart.
However, on the previous two occasions, the "death cross" on the bitcoin chart did not coincide with the beginning of a protracted bear market. In September 2023 and August 2024, after the formed trading pattern, the bitcoin price was in a sideways movement for about a month. After that, the quotes grew for several months.
But then the slope of the SMA50 was flat. In 2022 and now, as we can see on the chart, the slope angle of the SMA50 is steep, and according to the logic and experience of 2022, based on the chart, the steep slope angle for the SMA50 is currently repeating, which may indicate the protracted nature of the decline in the price of BTC, and therefore the entire market as a whole.
We'll wait and see!
Be healthy and please take care of yourself!


![[The $0 Growth Hack]: How To Build a 1-Million-User Empire in 2 months](https://cdn.publish0x.com/prod/fs/cachedimages/3731945950-e221973c3b382a1996b83b7ff6d063e191f6be57889a4e0bf3926d37de0a6d35.jpg)