
I stared at this chart for a long time before writing anything. I wanted to be sure I was seeing what I was seeing, not what I wanted to see.
Here are the facts. We're on day 757 after the 2024 halving. In the 2012 cycle, by this point Bitcoin had already done an 80x. 2016 cycle — 10x. 2020 cycle — 5x. 2024 cycle — roughly 1.5x. The black line on the chart is crawling along the bottom, as if it never even heard about the halving.
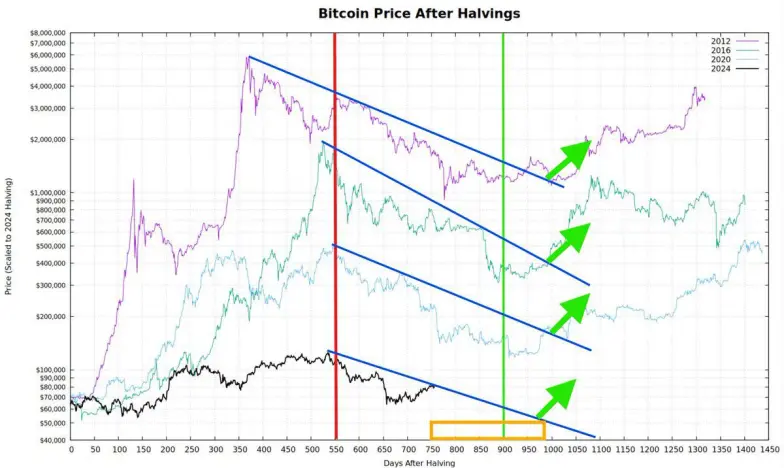
And here's what's interesting. Over these 757 days, the market has buried absolutely everything. The supercycle — didn't work. The five-year cycle — missed. The M2 global liquidity fractal — missed. The business cycle — missed. Talking heads who promised $250K by summer — also missed.
I myself bought into the M2 narrative. Looked at the correlation, nodded along, thought "well, it's logical." And then the market did what it always does — it went where it hurts the most.
But there's one detail that keeps me from closing this chart. The orange zone at the bottom — 800–950 days after the halving. This is the zone where, in every previous cycle, the bottom formed before the final reversal. The green arrows show that each time — every single time — after this zone, the price shot sharply upward.
There are 43 days left until day 800. Until day 900 — 143.
I'm not saying that history is obligated to repeat itself. This cycle has already proven it can surprise. But I'm saying something else: if you're sitting in a position right now thinking "maybe everything is broken" — look at the chart again. Every previous cycle looked broken at exactly this point. And then it stopped being broken.
The hardest thing in the market isn't buying or selling. The hardest thing is doing nothing when everything inside you is screaming that it's time to run. We're almost in the zone. Just have to endure a little longer.






