
I’m looking at the US presidential cycle statistics… and the picture is quite stubborn.
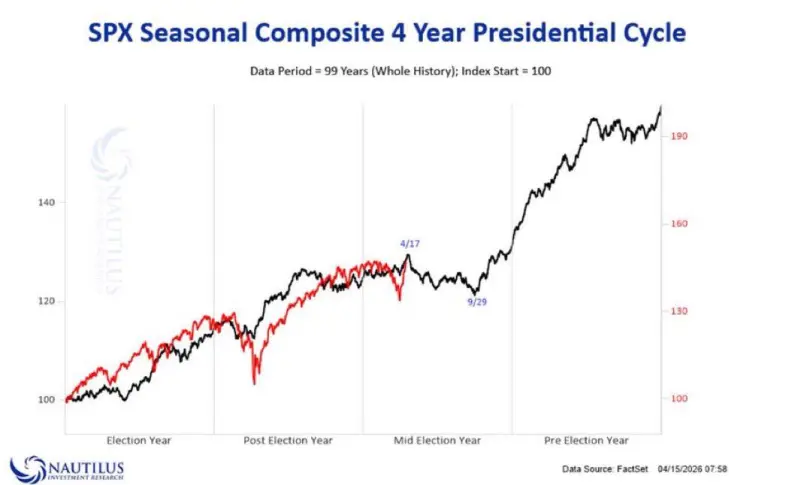
Every mid‑election year brings market weakness.
Not just symbolic — quite tangible: on average about –15–20%.
And it’s not just one or two cases.
Almost every cycle over the past decades has gone through this phase.
1974 Ford: –35%
1978 Carter: –15%
1982 Reagan: –17%
1986 Reagan: –10%
1990 Bush: –20%
1994 Clinton: –8%
1998 Clinton: –22%
2002 Bush: –34%
2006 Bush: –8%
2010 Obama: –17%
2014 Obama: –10%
2018 Trump: –20%
2022 Biden: –27%
2026 Trump: ???
And right now, it feels like we’re approaching that same point.
April 2026.
The upper part of the second year of the cycle.
If the scenario repeats…
then the next 6–9 months will be a correction zone.
Not necessarily linear.
With bounces, attempts to make new highs, false signals.
But overall — weakness.
And here’s the thing I’m paying attention to.
Such phases rarely look like “everything drops at once”.
Usually it’s an exhausting process where the market simply doesn’t let you make money.
And gradually it knocks out those who entered too late or without a plan.
However, historically, what comes next is a completely different story.
After midterm corrections, the market moved into a strong growth phase —
the pre‑election and election year.
And that’s the most interesting part of the cycle.
So for myself, I’m noting a simple idea right now:
if the pattern holds —
then the coming months may not be a time for growth,
but a time for preparation.
Preparation for the next move.






