
Colleagues, there's a simple but uncomfortable pattern.
Historically, BTC bull phases have lasted approximately 150–152 weeks.
Bear phases — around 52–54 weeks.
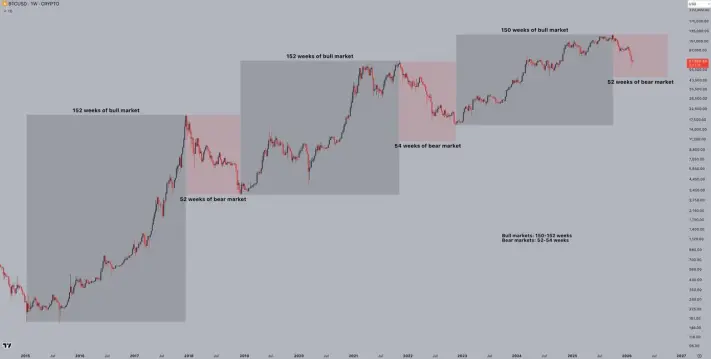
2015–2018 — ~152 weeks of growth → ~52 weeks of decline.
2019–2021 — ~152 weeks of growth → ~54 weeks of decline.
2023–2025 — the current cycle lasted about 150 weeks until the peak.
If the structure repeats, the current bear phase could take about a year.
This is not a forecast. This is a rhythm.
Counting from the estimated cycle top, the potential bottom shifts closer to autumn — around October.
What does this mean?
Firstly, the market rarely reverses instantly.
Secondly, a bear phase is not just a price drop, but a phase of time.
Time is the primary tool for cleansing excessive optimism.
Right now, most participants are trying to guess the "price bottom."
But historically, the more important question is: has enough time passed?
And this is where the risk appears:
if the cycle maintains symmetry, the current weakness might not be the finale, but merely the midpoint of the cooling-off process.
The Key Idea.
BTC cycles are rhythmic.
Not perfectly, but surprisingly consistent.
Ignoring this means ignoring the market's behavioral structure.
Want me to break down how I'm incorporating this time-based scenario into my strategy until the end of 2026, and where the asymmetry for position entry appears in that case?






