
A coworker has asked me to give him an estimate of Taraza TARA, a cryptocurrency that recently switched from the Ethereum network to its own network.
He asked me to use the indicators that I use for short-term commodity studies. And I thought that they might be useful to you too. Let's get to the point.
Tarasa TARA has become a layer-1 within the Ethereum network. Maintaining compatibility with smart contracts. Achieving a reduction in shipping costs and increasing its speed.
Charts with screenshots from Tradingview, on one-day candles.
The study is divided into three parts.
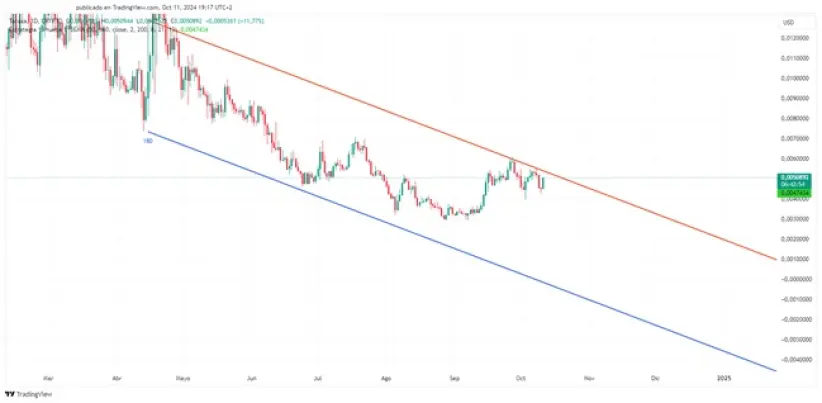
- 1.- The first indicator tries to create a channel between 50 and 180 records. In this case it has managed to create a maximum channel of 180 records. As we can see in the graph, its trend is clearly bearish. Although in recent days it has been trying to break the resistance of the channel, we will have to wait to see if it manages to break it or if its downward trend continues.
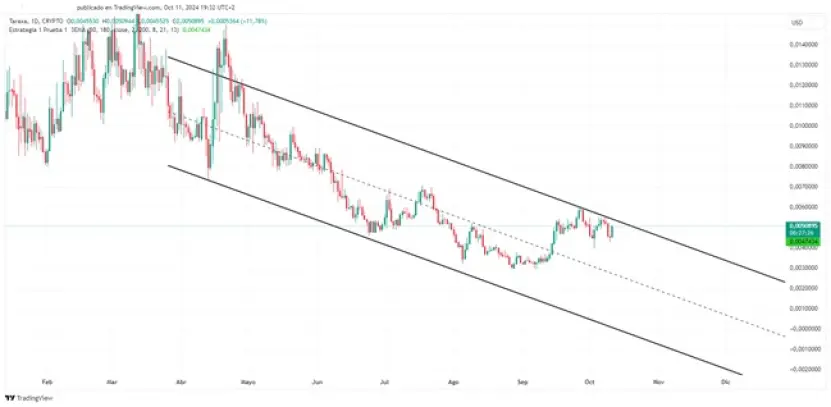
- 2.- The second indicator creates a fixed channel of 200 records. The number of records is fixed and calculated by linear regression. The result is very similar to the previous graph. Very pronounced downward trend and trying to break the resistance.
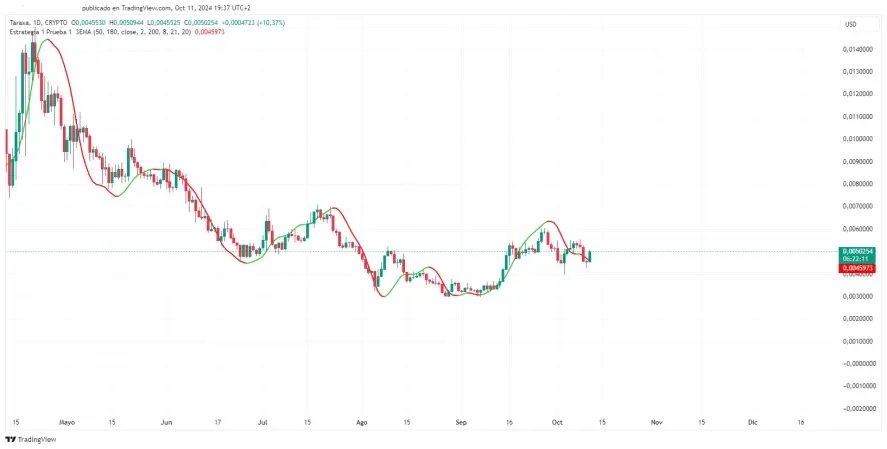
- 3.- The third indicator is a very short-term buy line. As we can see, it is red, which indicates that the price is falling. When the line changes to green, it would be time to buy and when it changes to red, it would be time to sell. But this indicator can change very quickly.
Conclusion
In the short term (2 months) I see a bleak future for this currency. Although it is trying to break the channels, it would be better to wait at least 15 days to see its evolution.
The world of cryptocurrencies is so volatile that any news can serve as a catalyst for a rise or fall.
If anyone wants me to do a simple study like this on any cryptocurrency, let me know in the comments.






