
Ethereum has been experiencing continuous price declines for several months now. A situation that is reaching a worrying point.
ETH/USDT daily chart. Source: Tradingview
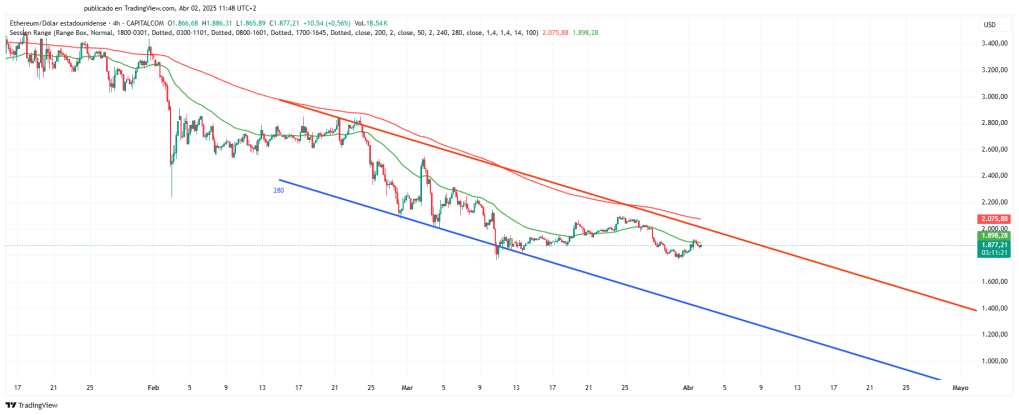
In the chart, we can see a channel in the price history (blue and red lines). We can see that the price is in a bearish channel that has lasted for more than six months. It has made a few attempts to break through resistance, but without success.
Producing breaks of the support line, which, even if the price subsequently returns to the channel, are signs of short- and medium-term weakness. While the resistance line remains intact.
The slow moving average (200-period red) is above the fast moving average (50-period green), indicating a downward trend. The slow moving average has been above the fast moving average for a long time, with no signs of attempting a crossover. This situation, if prolonged, could indicate a very steep drop in the Ethereum price.
Conclusion:
Taking into account the above:
- A downward-trending channel
- Continuous testing of the support line.
- A price is below the 200-period slow exponential moving average.
In my humble opinion, based on my experience and the data available to me, I don't see any signs of Ethereum rising in price. If the current situation doesn't reverse, I don't see investing in Ethereum as a good option.
There are investors who only invest when one of the major currencies is going through a bad time. This may be one of those cases, although the risk is high, as is the possibility of recovery.
But I don't see the situation clearly. It would almost be better to do nothing and wait for the market to take its course.
Configuration:
- 4-hour candlestick chart
- 280-period trend channel
- 50-period exponential moving average
- 200-period exponential moving average


