
Let's buy Bitcoin versus Ethereum to determine which of the two has performed better in recent years.
To conduct this comparison, we'll use data provided by Tradingview and create a chart for your convenience. At the end of the article, I'll share the indicator I programmed to conduct this comparison.
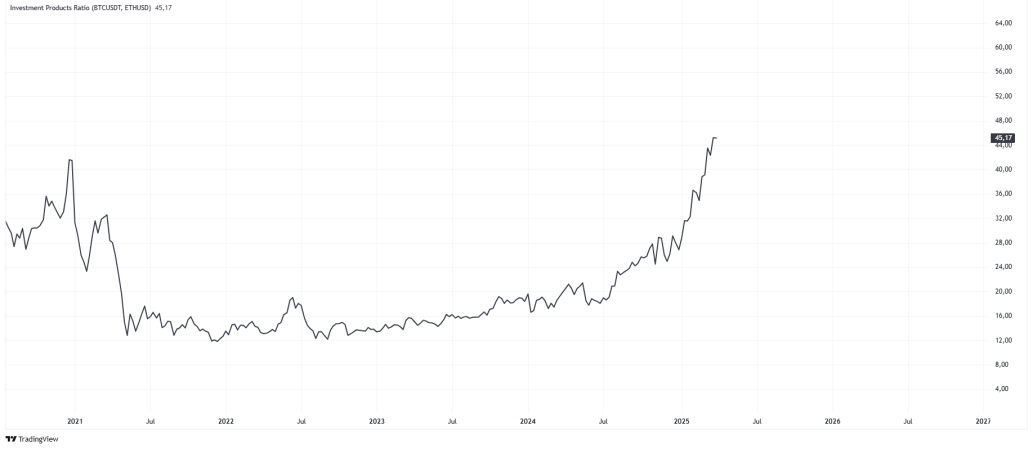
The chart shows the evolution of BTC/ETH. As you can see, from mid-2022 to mid-2024, the amount of ETH needed to buy one Bitcoin was about 14 to 18.
In the second half of 2024, the price of Bitcoin began to rise, while Ethereum could not keep up with these increases. As of today, April 2, 2025, 45 ETH are needed to buy one Bitcoin.
We can say that investing in Bitcoin has been much more profitable than investing in Ethereum. However, it's important to keep in mind that the situation can also be reversed.
Conclusion:
In my humble opinion, experience, and the data available to me, Ethereum's price/performance performance has been negative relative to Bitcoin.
We see no indication in the market that this trend could be reversed.
There are investors who only invest when one of the major currencies is going through a bad time. This may be one of those cases, although the risk is high, as is the possibility of recovery.
Configuration:
- 1-week candlestick chart
- Indicator: Investment Product Ratio
Indicator:
//@version=5
//
// Investment Product Ratio Indicator
// ## Description:
// This indicator allows you to compare two investment products by calculating their ratio.
// To do this, the user enters the symbols of two financial assets, and the indicator
// obtains their closing prices on a one-day timeframe.
// The price of the first product is then divided by the second to generate a data series
// that is graphed in an indicator window.
//
// ## Input Parameters:
// - `Product 1`: Symbol of the first financial product.
// - `Product 2`: Symbol of the second financial product.
//
// ## How it Works:
// 1. Enter the symbols of the two products to be compared.
// 2. Obtain the closing price of each product on the daily timeframe.
// 3. Calculate the ratio by dividing the price of the first product by the second.
// 4. The ratio data series is graphed for visual analysis.
//
// ## Purpose:
// - Relative comparison between two assets.
// - Identification of trends and arbitrage opportunities.
// - Evaluation of the relative strength of one asset over another.
//
indicator("Investment Products Ratio", overlay=false)
// Entry of the two investment products
product1 = input.symbol("BINANCE:BTCUSDT", "Product 1")
product2 = input.symbol("BINANCE:ETHUSD", "Product 2")
// Get closing prices
price1 = request.security(product1, "D", close)
price2 = request.security(product2, "D", close)
// Calculate the ratio
ratio = price1 / price2
// Graficar el ratio
plot(ratio, title="Product1 / Product2 Ratio", color=color.black, linewidth = 2)


