
Bitcoin has been in a sharp decline for a few days. It recovers, but with no strength left, it falls again.
BTC/USDT daily chart. Source: Tradingview
Making a prediction today is complicated. We've had a drop for no apparent reason; the market is calm, but with the inherent anxiety of not knowing what the next path might be. The long-term trend is bullish, but the short-term trend is clear.
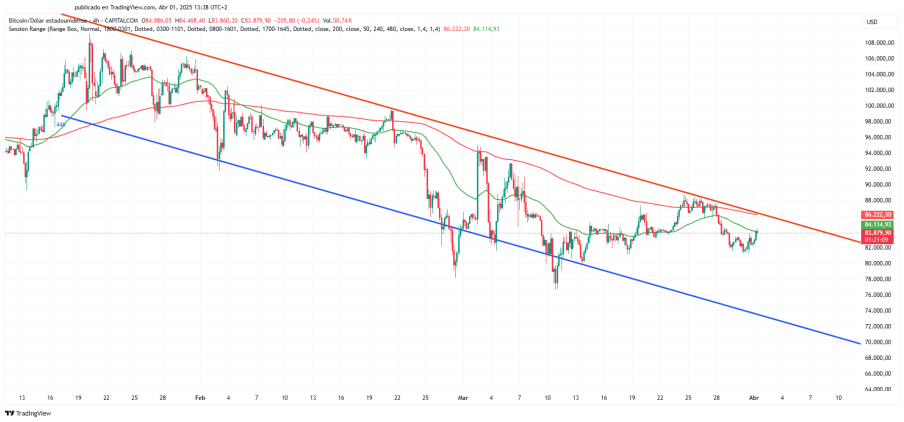
In the chart, we can see a channel in the price history (blue and red lines). We can see that the price is in a bearish channel that has lasted for more than two months. It has attempted to break through resistance, but has been unsuccessful. And the price is constantly returning to lower lows.
Producing breaks of the support line, which, even if the price subsequently returns to the channel, are signs of short- and medium-term weakness. While the resistance line remains intact.
The slow moving average (200-period red) is above the fast moving average (50-period green), indicating a downward trend.
Conclusion:
Taking into account the above:
- A downward-trending channel
- Continuous testing of the support line.
- A price is below the 200-period slow exponential moving average.
In my humble opinion, experience, and the data available to me, we can do several things:
But I don't see the situation clearly. It would almost be better to do nothing and wait for the market to take its course.
Configuration:
- 4-hour candlestick chart
- 446-period trend channel
- 50-period exponential moving average
- 200-period exponential moving average


