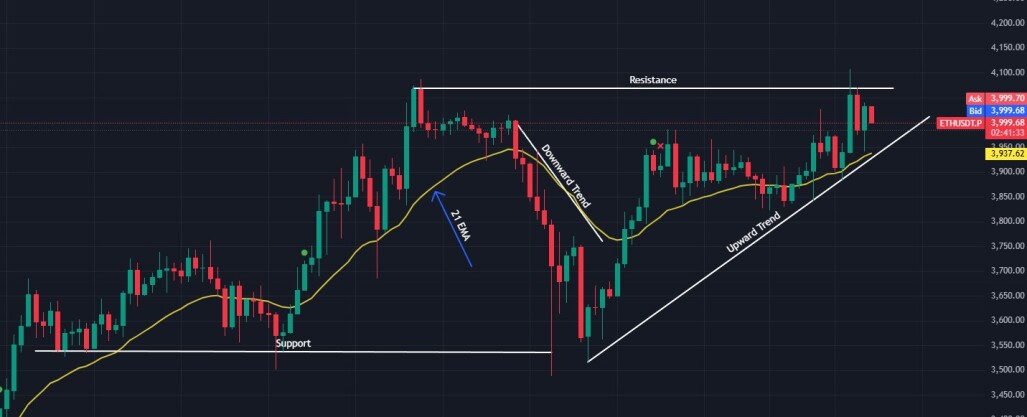
Technical analysis acknowledges that all crypto rise and fall in price constantly, in response to supply and demand. By honing in on price movements within a timeframe, analysts seek to identify patterns. A crypto token's price may stay a support level, below which its price won't drop. It may also show a resistance level, at which buyers back off; thus, price won't rise above. Support and resistance are two foundational concepts in technical analysis and can be identified on charts using trendlines and moving averages. Understanding what they are and how they work is essential to correctly reading a price chart. Support occurs at the point where a downtrend is expected to pause, due to a concentration of demand. Resistance occurs at the point where an uptrend is expected to pause, due to a concentration of supply. Support and resistance areas can be identified on charts using trendlines and moving averages.
Trendlines are easily recognizable lines that traders draw on charts to connect a series of prices together. The resulting line is then used to give the trader a good idea of the direction in which an token's value might move. Trendlines are a visual representation of support and resistance in any time frame. They show direction and speed of price, and also describe patterns during periods of price contraction. Trendlines are valuable tools for chart analysis, providing a visual representation of data's best fit through a single line or curve, clarifying the underlying trend. These lines can connect highs and lows to form channels, aiding in the identification of potential supply and demand zones. While the specific time period and data points used to construct trendlines can vary among traders, higher time frames generally yield more reliable results. Importantly, trendlines should naturally align with the chart's price action and should not be artificially forced to fit. When correctly applied, trendlines can help traders spot potential buying and selling opportunities within a prevailing trend.
Trendlines offer a window into market psychology, revealing the ongoing struggle between buyers (bulls) and sellers (bears). An ascending trendline signals bullish dominance and strong market optimism, indicating that buyers are consistently pushing prices higher. Conversely, a descending trendline reflects bearish control and pervasive pessimism, suggesting sellers are driving prices lower. Therefore, when the market is in a downtrend, the trendline is positioned above the price action, effectively acting as a resistance level that prices struggle to break. Conversely, during an uptrend, the trendline is drawn below the price, serving as a support level, preventing further declines. Constructing a trendline involves connecting at least two significant swing highs or swing lows on a price chart. Traders differ in their approach, some utilize the candlestick bodies (the wider part of the candlestick) to draw these lines, while others opt for the wicks (the thin lines extending above and below the body), representing the highest and lowest prices reached during that period
Most technical traders incorporate various technical indicators, such as moving averages, to aid in predicting future short-term momentum. People who find it difficult to draw trendlines often substitute them with moving averages. A moving average is a constantly changing line that smooths out past price data, allowing for easier identification of support and resistance. Traders can use moving averages to anticipate moves to the upside, when price lines cross above a key moving average. They also use them to exit trades, when the price drops below a moving average. Regardless of how the moving average is used, it often creates automatic support and resistance levels. Most traders experiment with different time periods in their moving averages to find the one that works best for their trading time frame.
Recognizing support and resistance levels is crucial for traders seeking strategic entry and exit points in the market. These levels, representing price points where buying or selling pressure is expected to be strong, are often used to determine optimal trade setups. However, the effectiveness of these levels is not solely based on technical analysis, human emotions and cognitive biases, such as fear and greed, significantly influence market behavior around these price points. Furthermore, trading volume typically surges at support and resistance levels, indicating heightened market participation and making it more challenging for traders to decisively push prices beyond these established barriers. This increased activity reinforces the strength of these levels, as a greater number of market participants are actively buying or selling at these key price thresholds. By understanding and utilizing trendlines and moving averages, traders can better identify support and resistance levels, potentially improving their ability to make informed trading decisions.