Crypto trading relies heavily on understanding price action. Candlesticks, those colorful blocks on charts, visualize price movements over specific timeframes. Green candles indicate an upward close, red a downward close. Wicks show the high and low prices reached. Patterns like engulfing and shooting stars signal potential reversals. Timeframes range from short-term (1-minute) to long-term (monthly), each offering a unique perspective. Analyzing multiple timeframes helps confirm trends, identify divergences, and plan entries and exits strategically. Successful traders prioritize risk management (stop-losses, position sizing) and continuous learning, adapting their strategies to the ever-changing market.
Candlesticks
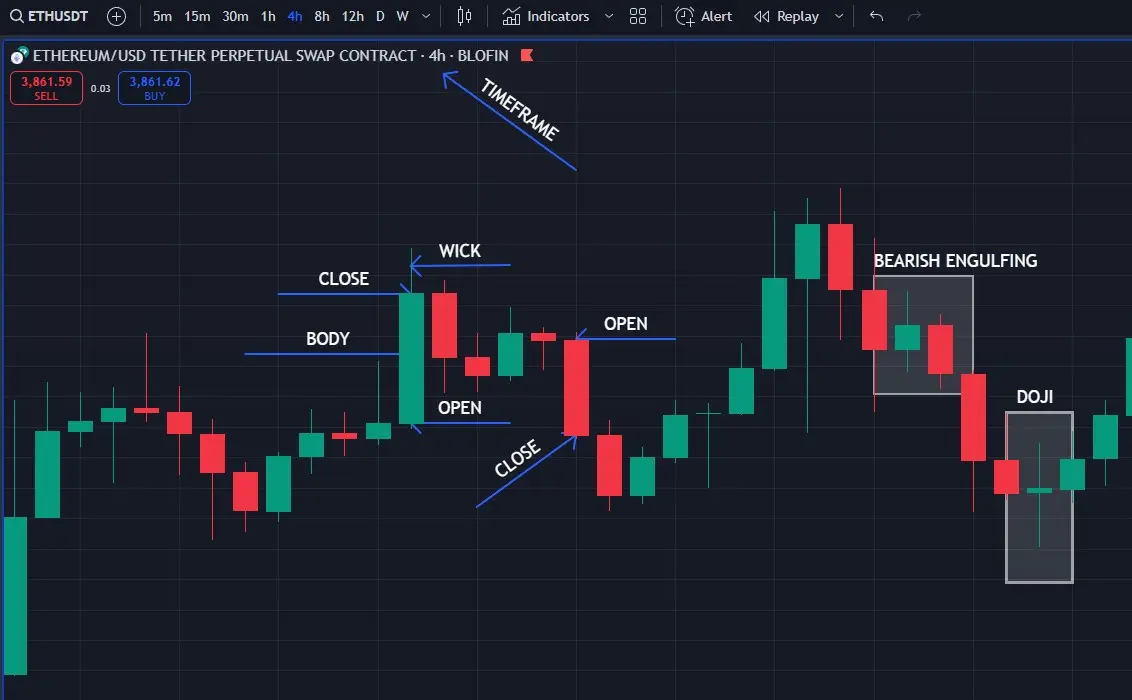
Candlesticks are powerful tools in the arsenal of cryptocurrency traders, offering a visual representation of price movements within specific time periods. Developed centuries ago by Japanese rice traders, these charting elements have stood the test of time and remain crucial for modern technical analysis. Each candlestick encapsulates four critical price points: the open, high, low, and close. The body of the candlestick, typically colored green (or white) for bullish movements and red (or black) for bearish movements, represents the difference between the opening and closing prices. The thin lines extending from the body, known as wicks or shadows, show the highest and lowest prices reached during the specific trading timeframe.
The anatomy of a candlestick provides valuable insights into market sentiment. A long body indicates strong conviction in the price movement, while a short body suggests indecision or consolidation. The length of the wicks also carries significance, long wicks indicate price rejection at extremes, while short wicks suggest price stability within a range. Individual candlesticks can form recognizable patterns that traders use to predict future price movements. For instance, a Doji candlestick, where the opening and closing prices are nearly identical, suggests market indecision and a potential trend reversal. Multiple candlesticks can combine to form more complex patterns. The Bullish Engulfing pattern, for example, consists of a small red candle followed by a larger green candle that completely "engulfs" the previous one, signaling a potential bullish reversal. The Bearish Engulfing pattern is the exact opposite. Other notable patterns include the Morning Star (a bullish reversal pattern) and the Evening Star (a bearish reversal pattern), both consisting of three candlesticks. Of course there many more patterns that need to be explored and learned, however, that's were personal efforts kicks in to play.
Reading individual candlesticks is a crucial skill for crypto traders, as it provides valuable insights into market sentiment and potential price movements. The length of a candlestick's body offers significant information about market dynamics. Long bodies indicate substantial price movement, strong market conviction, and a clear directional bias. When traders encounter long-bodied candlesticks, they often interpret this as a sign of trend continuation, strong momentum, and clear market sentiment. In contrast, short-bodied candlesticks tell a different story. These candlesticks suggest limited price movement, market indecision, and possibly trend exhaustion. Traders viewing short bodies might anticipate a potential trend reversal or a consolidation phase, and typically wait for additional confirmation before making trading decisions. A special case is the Doji candlestick, which has virtually no body as the opening and closing prices are equal. Dojis represent complete market indecision and a balance between buyers and sellers. They often signal potential trend reversals and market uncertainty, prompting traders to seek additional confirmation before taking action.
The wicks of a candlestick also provide crucial information. Long wicks indicate price rejection at extremes. A long upper wick suggests rejection of higher prices and selling pressure above, potentially indicating a resistance level. Conversely, a long lower wick points to rejection of lower prices and buying pressure below, possibly signaling a support level. Short wicks, on the other hand, indicate price stability, strong trend control, and limited price rejection. When traders observe candlesticks with short wicks, they often interpret this as a sign that the current trend is likely to continue, with strong market control and a clear direction.
Recognizing these patterns requires practice and context analysis. Traders must consider the overall trend, volume confirmation, and support/resistance levels. It's crucial to wait for pattern completion and look for supporting indicators before making trading decisions. By mastering the art of reading candlesticks and identifying patterns, crypto traders can gain valuable insights into market sentiment and potential price movements, enhancing their ability to make informed trading decisions in the volatile crypto market.
Timeframes
In the world of crypto trading, the selection of timeframes is pivotal as they dictate the scope and strategy of your trades. A timeframe defines how long each candlestick on your chart represents, impacting everything from strategy development, pattern recognition, to risk management, trading psychology, and position management.
Traders have a spectrum of options starting with ultra-short term timeframes like 1-minute (1m), 3-minute (3m), and 5-minute (5Mm) charts, predominantly used for scalping and high-frequency trading. Moving up, short-term timeframes such as 15-minute (15m) and 1-hour (1H) cater to day traders seeking to capitalize on short-term positions. Medium-term timeframes, including 4-hour (4H) and 12-hour (12H) charts, are ideal for swing traders and those following market trends. For a broader perspective, long-term timeframes like daily (1D), weekly (1W), and monthly (1M) are utilized for position trading and investment, focusing on overarching market trends.
Short-Term Timeframes (1m-30m) are characterized by high volatility, where rapid price movements and quick pattern formations are common, offering frequent trading signals. However, they also suffer from significant market noise, including false breakouts and random price spikes visible due to high trading volume. The advantages include the ability to seize quick trading opportunities, enabling multiple trades daily with precise entry and exit points. Yet, this comes with psychological pressure due to the need for rapid decision-making, potentially leading to emotional trading, and the resource-intensive nature of constant monitoring.
Medium-Term Timeframes (1H-12H) offer a balanced view with reduced noise, providing clearer trends and more reliable patterns. The volatility is moderate, which aids in identifying clearer support and resistance levels. This timeframe allows for better trend visibility, facilitating reliable breakouts and balanced risk management with reasonable stop-losses and profit targets. However, the time commitment required for regular monitoring and the opportunity cost of missing out on short-term moves can be seen as disadvantages.
Long-Term Timeframes (1D-1M) focus on major trends with reduced noise, offering clean price action and clear market structure. These charts help in identifying strong trends, major reversals, and key levels with obvious support and resistance, leading to lower stress from reduced monitoring needs. However, they require larger capital investments due to wider stop losses, and opportunities for trades are more limited, leading to longer waiting periods and slower capital turnover.
Trading Style Alignment
Scalping Strategy thrives on 1m-5m charts with secondary use of 15m-1H timeframes for trend confirmation. Scalpers look for quick trades with tight stops to accumulate small profits through high-frequency trading. Implementation involves looking at price action signals, volume confirmation, and support/resistance level breakouts for entries, with a strategy for quick profit-taking, tight stop losses, and sometimes time-based exits.
Day Trading Approach uses 15m-1H charts primarily, with the 4H timeframe for broader trend analysis. Day traders manage intraday positions, making multiple trades daily. Their strategy includes setting trades based on pattern completion, support/resistance levels, and trend alignment, with a focus on position sizing, stop placement, and setting profit targets for risk management.
Swing Trading Method is best executed on 4H-1D charts, with weekly timeframes for trend confirmation. This method involves holding positions for multiple days, focusing on following trends and trading patterns. Implementation includes identifying strong trends, confirming patterns across multiple timeframes, and managing positions with trailing stops, taking partial profits, or scaling positions.
Timeframe Analysis
A top-down analysis framework is key, starting with Long-Term timeframes to identify major trends, patterns, and key support/resistance levels. From there, the Medium-Term timeframe is used for spotting entry opportunities, pattern formations, and stoploss placement. Short-Term timeframes refine these decisions, optimizing for precise entries and exits. Checking for timeframe correlation involves ensuring trend alignment, pattern confirmation, and level confluence, across different timeframes.