
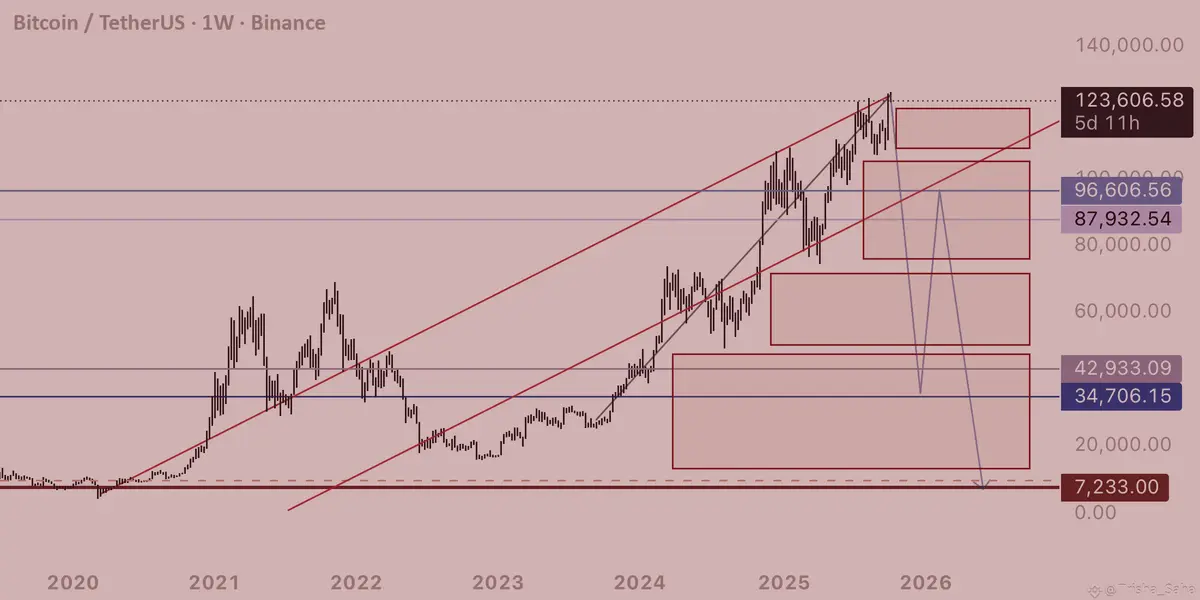
If you checked your portfolio app on June 8, 2026, there's a good chance you shut it down in a hurry. Bitcoin had slid to $63,310 down 11% in just one week. Ethereum broke under $1,700 for the first time in over two years. The entire crypto market lost about $400 billion in just a month. Everywhere you looked on Crypto Twitter, people kept repeating the same word: capitulation.
I've seen enough of these crashes to know that panic costs more than anything else in crypto. Think back: the long bear market in 2018, the COVID crash in March 2020, the FTX blowup in November 2022, the Luna disaster in May 2022. Every single time, people swore, "This time is different. It's over." But it never was.
I’m not here to give you financial advice. What I want is to take a clear look at what’s actually playing out in June 2026 why it’s happening, and what everyday investors need to think about for their portfolios right now. No hype, no wild predictions, and I’m not here to tell you to ‘buy the dip.’ Just the facts, what’s driving this moment, and what you need to know next.
What Actually Happened: A Timeline
Let's walk through the crash chronologically, because the order matters.
May 2026: The Setup
Honestly, the seeds for that nasty June crash were planted back in May. After Bitcoin went on a wild ride and touched $109,000 in Q4 2025, things started fading. By Q1 2026, institutional ETF holdings had slid 17% from 313,000 BTC to just 261,000 BTC. Early May looked promising with $3.29 billion flooding into ETFs, but then $1.26 billion flowed right out by month’s end. Sure, inflows were still positive, but the vibes were getting uglier.
Meanwhile, the 10-year Treasury yield was creeping up. The Fed basically said, “Get used to higher rates” at the May FOMC meeting. Risk assets everywhere including crypto were feeling the squeeze.
June 1: The Iran Catalyst
Then, on June 1, rumors hit that the U.S. was weighing military action against Iran because of escalating proxy attacks in the Strait of Hormuz. Boom Bitcoin drops 4% in just six hours. Gold shot up, oil shot up. Everyone went risk-off. It wasn’t just crypto, but those rumors shattered the technical support Bitcoin had been chilling on since March.
June 5-7: The Strategy Sale
Now, this is where the narrative totally unraveled. On June 5, Strategy (yeah, that’s MicroStrategy’s new name) announced it had unloaded about $3.2 million worth of Bitcoin between June 1-7 to pay a preferred stock dividend. Let’s be real: $3.2 million is peanuts for a company sitting on 568,000 BTC. But here’s the kicker Michael Saylor’s crew had never sold Bitcoin before. The “diamond hands” legend that held the retail crowd together? Shattered.
Fortune dropped an analysis on June 9 highlighting the real mess: Strategy had issued billions in preferred stock (STRD, STRK, STRC) with fixed dividends. If Bitcoin kept crashing, they’d have to sell more to cover those dividends, which would shove prices even lower, which would force more selling. Just a classic corporate death spiral, but with way fancier words.
Sure, Strategy tried to patch things up by buying back $101 million in Bitcoin the next week, but let’s face it the market saw what was under the hood. You can’t unsee that trigger.
June 8-12: ETF Outflows Accelerate
ETF flows turned brutal. For 13 days straight, record outflows stacked up to $4.4 billion. BlackRock’s IBIT took its first real redemption hit since it launched. Fidelity’s FBTC? Even worse. The idea that institutions were “buying the dip” got torched turns out, they were leading the pack in dumping their holdings.
Bitcoin smashed through $65,000 and then $63,000. Ethereum broke past $1,800, then $1,700. BTC and ETH stayed glued together in high correlation (~0.92), so there was zero rotation happening just straight-up liquidation.
June 12-20: Stabilization Attempts
Crypto tried to rally a few times, but every relief bounce just got sold off. The old “buy the dip” mindset that worked in 2024 and 2025? Now, it was crushing anyone who dared. By June 20, the market was worn out, and daily volatility hit lows we hadn’t seen in months. That kind of calm usually means either a sharp turnaround or one last painful flush lower.
The Three Real Causes (Not What Crypto Twitter Says)
The chatter on Twitter blames the crash on a dozen different things. Most of them are noise. Here are the three structural causes that actually matter.
Cause 1: The Fed Did Not Pivot
The single biggest driver of crypto prices in 2024-2025 was the expectation that the Federal Reserve would cut interest rates aggressively in 2026. That expectation was priced into Bitcoin at $100K+, into ETH staking yields, into the entire DeFi bull case.
The Fed did not pivot. Inflation stayed sticky at 3.1% core PCE. The May FOMC meeting signaled "higher for longer" through at least Q3 2026. The market is now pricing in maybe one rate cut in 2026, possibly zero. When the risk-free rate is 4.5% and your alternative is a volatile crypto asset, the math gets harder.
This is not a crypto problem. The S&P 500 is down 8% from its 2025 highs. Gold is up. Bonds are flat. The macro environment is hostile to risk assets, period.
Cause 2: The ETF Trade Is Unwinding
In 2024, spot Bitcoin ETFs were the bull case. Wall Street was buying. $115 billion in assets by late 2025. The narrative was "institutions are here, they will hold forever."
The reality is more complicated. ETF holders are not all diamond-hand believers. A large chunk are hedge funds running basis trades (long spot ETF, short CME futures, capture the premium). When the premium compresses or goes negative, those funds unwind. That means selling the ETF and buying back the short. The ETF outflows we are seeing in June 2026 are not necessarily conviction selling. They are basis trade unwinds.
The problem: when basis trades unwind in size, they push spot prices down, which triggers more basis trades to unwind, which pushes prices down further. It is the same dynamic that hit the Treasury market in March 2020, and it is genuinely hard to stop once it starts.
Cause 3: The Strategy Mechanism Is Now Visible
For five years, Michael Saylor's Strategy was the ultimate Bitcoin buyer. Every dip, every rally, every week, they bought more. Funded by convertible debt, then preferred stock, then perpetual preferred. The market loved it because it was predictable demand.
The June 2026 sale, even though tiny, exposed the mechanism's vulnerability. If BTC drops far enough, the dividend obligations on the preferred stock (STRD paying 8%, STRK paying 10%, STRC paying 11%) become unsustainable without selling BTC. That creates a feedback loop. The market is now pricing that risk into both MSTR stock (down 35% from highs) and BTC itself.
This is not a prediction that Strategy will collapse. They have plenty of headroom. But the market has re-rated the risk, and that re-rating takes time to absorb.
What You Should Actually Do Right Now

OK, enough diagnosis. Here is the action plan. I am going to give you three different playbooks depending on your situation. Pick the one that fits.
Playbook 1: You Are Long-Term Bullish (3+ Year Horizon)
If you genuinely believe Bitcoin and Ethereum will be higher in 2029 than they are today, the right move is boring and unsexy: dollar-cost average.
The math on DCA is brutal in both directions. Investopedia's DCA primer lays it out clearly: you invest the same amount at regular intervals, regardless of price. The math works because you buy more shares when prices are low and fewer when prices are high. Your average cost per share ends up lower than the average price over the period.
Concretely for crypto in June 2026:
- Set a weekly buy of $X for BTC and ETH (whatever X you can afford to lose)
- Use a recurring buy feature on Coinbase, Kraken, or your exchange of choice
- Do not look at the price between buys. Seriously. Delete the app from your home screen if you have to.
- Re-evaluate every 90 days, not every 90 minutes
The psychological benefit of DCA during a crash is enormous. You stop trying to time the bottom. You stop panicking. You just execute the plan. The 2018-2019 DCA crowd who bought weekly from $19K down to $3K and back up to $9K crushed the lump-sum buyers who tried to time it.
# Simple DCA simulator: average cost vs lump sum
# Run this with: python dca_simulator.py

def simulate_dca(prices, weekly_amount):
    """
    prices: list of weekly BTC prices
    weekly_amount: dollars invested each week
    Returns total BTC accumulated, total spent, average cost
    """
    total_btc = 0.0
    total_spent = 0.0
    for price in prices:
        btc_bought = weekly_amount / price
        total_btc += btc_bought
        total_spent += weekly_amount
    avg_cost = total_spent / total_btc if total_btc > 0 else 0
    return total_btc, total_spent, avg_cost

def simulate_lump_sum(prices, total_amount):
    """Invest everything at the start."""
    btc_bought = total_amount / prices[0]
    avg_cost = total_amount / btc_bought
    return btc_bought, total_amount, avg_cost

# Example: 52 weeks of crashing prices, $100/week
prices_2026_scenario = [95000, 92000, 88000, 84000, 79000, 75000, 72000,
                        68000, 65000, 63000, 60000, 58000, 56000, 54000]
# ... (52 weeks total)

weekly = 100
dca_btc, dca_spent, dca_avg = simulate_dca(prices_2026_scenario, weekly)
lump_btc, lump_spent, lump_avg = simulate_lump_sum(prices_2026_scenario, weekly * len(prices_2026_scenario))

print(f"DCA:     {dca_btc:.4f} BTC, avg cost ${dca_avg:,.0f}")
print(f"LumpSum: {lump_btc:.4f} BTC, avg cost ${lump_avg:,.0f}")
print(f"DCA advantage: {(dca_btc - lump_btc)/lump_btc * 100:.1f}% more BTC")
In a steadily declining market, DCA beats lump sum almost every time. In a V-shaped recovery, lump sum wins. The honest answer is that nobody knows which scenario we are in, but DCA's downside protection makes it the better risk-adjusted choice for most people.
Playbook 2: You Are Sitting in Cash, Tempted to Buy the Dip
This is the most dangerous position to be in, because FOMO and capitulation look identical from the inside. Here is a framework to tell them apart.
Ask yourself: "If BTC drops another 30% from my entry price, will I be financially OK?" If the answer is no, you are buying too much. Cut your position size by 75% and deploy slowly.
The temptation right now is to look at the chart, see BTC at $63K (down from $109K), and think "discount." Maybe. But the 2022 low was $15K. The 2018 low was $3K. Crypto has historically drawn down 75-80% from cycle highs. We are currently at a 42% drawdown. By historical standards, "average crash" would take us to $25-30K. That is not a prediction. That is just math.
If you must deploy now, do it in tranches. Split your cash into 10 equal parts. Deploy one part per week for 10 weeks. If BTC is at $50K by week 5, you will be glad you did not go all-in at $63K. If BTC is at $80K by week 5, you will still have made money. Either way, you avoided the worst-case scenario.
Playbook 3: You Are Holding Bag Positions from Higher Prices
This is the hardest one emotionally. You bought SOL at $280. You bought ETH at $4,000. You bought LINK at $25. They are all down 50-70%. What do you do?
Step one: stop pretending. Look at your portfolio at current market prices. That is your real position. The cost basis is a sunk cost. It does not matter for forward-looking decisions.
Step two: ask "would I buy this asset today at this price, with fresh cash?" If yes, hold. If no, sell and move to something you would buy. This is painful but honest.
Step three: tax-loss harvest. In the U.S. and many other jurisdictions, you can sell at a loss, realize the capital loss for tax purposes, and immediately buy a similar but not identical asset. For crypto, you can even buy back the same asset immediately (no wash sale rule for crypto as of 2026, unlike stocks). Talk to a CPA, but do not leave free tax losses on the table.
Step four: do not revenge trade. The worst thing you can do after a 50% loss is to take on leverage to "make it back." That is how people lose everything. If you are tempted to use leverage right now, re-read this paragraph until the temptation passes.
The Smart Money Plays You Are Not Hearing About
The default crypto media response to a crash is "buy the dip." There are smarter things to do that get less coverage.
Move Stablecoins to Yield Platforms
If you are holding USDC or USDT on an exchange earning 0%, you are leaving yield on the table. As of June 2026, realistic stablecoin yields range from 4% to 9% APY depending on the platform and risk tolerance:
- CeFi: Binance, Nexo, BlockFi offer 6-14% on USDC/USDT (counterparty risk)
- DeFi lending: Aave, Compound, Spark offer 3.5-5% on major chains (smart contract risk)
- DeFi leveraged strategies: Pendle, Ethena, MakerDAO sDAI offer 5-9% (complex risk)
The Spark stablecoin yield comparison tool is the best free resource for comparing current rates across protocols. Do not chase the highest yield. Pick a platform you understand, with risks you can articulate.
Stake Your ETH (If You Are Long)
Ethereum staking yields in June 2026 are running around 3.2-3.5% APY. That is not life-changing, but it compounds. If you are holding ETH anyway and planning to hold for 2+ years, not staking is leaving 3% on the table annually.
The BlackRock iShares Staked Ethereum Trust ETF (ETHB) launched in March 2026, waiving sponsor fees for the first 12 months at 0.12% expense ratio. If you want staking exposure in a tax-advantaged account (IRA, 401k), that is the cleanest vehicle. If you want to self-custody and stake directly, use Lido, Rocket Pool, or run your own validator (32 ETH).
Rebalance, Do Not Liquidate
If you had a target allocation (say 60% BTC, 30% ETH, 10% alts), the crash has probably skewed it. Rebalancing means selling some of the asset that did relatively better and buying more of the one that did relatively worse, to get back to your target.
This is mechanically the same as "buy low, sell high," but framed as maintenance rather than trading. Most brokerage accounts and crypto exchanges offer automatic rebalancing. The psychological benefit is that you are not making directional bets, you are just executing a plan.
What NOT to Do Right Now
A quick list of things that will lose you money in the next 30 days.
Do not use leverage. Funding rates are negative on most perps, which means longs are being paid to hold. That sounds bullish, but it actually means shorts are dominating. If you go long with leverage, you are fighting the trend. Wait.
Do not buy options. Implied volatility is elevated, which means options are expensive. The market has already priced in more downside. Your puts are not as cheap as you think, and your calls require a massive move to break even.
Do not chase "bottom signals." Every crypto influencer on Twitter has a different bottom indicator. Fear & Greed index. MVRV. NUPL. Rainbow chart. They all work in hindsight and none of them work in real time. Stop looking for the magic indicator.
Do not average down on alts. If BTC drops 40%, alts typically drop 60-80%. The "BTC drags everything down, alts recover faster" thesis works in bull markets, not in structural bear moves. If you have weak alts, this is the time to rotate into BTC and ETH, not the other way around.
Do not panic sell at the bottom. Easier said than done, but if you have held this long, the worst time to sell is after a 40% drop. Either you believed in the thesis at $100K (in which case $60K is a better entry), or you did not really believe it (in which case you should have sold earlier). Selling now is the worst of both worlds.
The Bigger Picture: This Is Normal

Crypto has had five major drawdowns of 50%+ since 2013. Each one felt like the end of the world at the time. Each one was followed by a new all-time high within 2-3 years. That is not a guarantee, but it is the historical pattern.
The structural bull case for crypto in 2026 is intact. Bitcoin ETFs are still holding $80+ billion in assets. Ethereum staking yields are positive. Layer 2 activity is at all-time highs. The account abstraction upgrade (ERC-4337) is making wallets usable for non-technical people. Stablecoin circulation is at $200 billion and growing. None of that changed in the last 30 days.
What changed is the macro backdrop. The Fed got more hawkish. Geopolitics got more tense. A leveraged buyer (Strategy) showed its weakness. These are all fixable problems, given time.
The question is whether you have the time horizon to wait. If you do, this crash is an opportunity. If you do not, you should not have been in crypto in the first place. There is no shame in admitting that. The shame is in pretending you have a 5-year horizon when you actually have a 3-month horizon, and then being forced to sell at the bottom.
Final Thoughts
The June 2026 crash is not the end of crypto. It is also not the bottom, necessarily. Anyone who tells you they know where the bottom is, is lying. What I can tell you with confidence is this: the investors who come out of this crash in good shape are the ones who (1) did not use leverage, (2) had a plan they stuck to, and (3) did not let their emotions override their strategy.
If you are reading this with a portfolio that is down 40%, take a breath. You are not alone. You are not stupid. You are early in a cycle that is recalibrating. The next 6 months will be volatile, frustrating, and probably boring. That is what accumulation phases look like. Use the time to learn, to rebalance, and to position yourself for the next leg up, whenever it comes.
And if you see Michael Saylor on TV saying "this is the last chance to buy Bitcoin under $100K," mute the channel. You have heard that one before.
How are you handling the June 2026 crash? Holding, selling, or buying more? Drop your strategy in the comments. I read every one and reply to the interesting ones. If this article helped you avoid a costly decision, a tip is always appreciated.
Tags: #crypto #bitcoin #ethereum #crash #bearmarket #strategy #dca #investing
Watch & Learn: Crash Analysis Videos
Two YouTube videos worth your time. The first is a 23-minute analysis of what the Bitcoin crash means for the rest of 2026, with a focus on macro catalysts and historical comparisons. The second is Michael Saylor's Bitcoin 2026 keynote, which provides important context on the Strategy mechanism that contributed to the crash.
The next video is Michael Saylor's keynote from Bitcoin 2026, where he explains the STRC preferred stock mechanism. Understanding this is essential to understanding why the June 2026 Strategy sale spooked the market.
References & Further Reading
- Bitcoin crash analysis June 12, 2026 (Intellectia): intellectia.ai/blog/bitcoin-crash-june-2026-market-analysis-june-12
- Three causes of the 2026 crash (TradingKey): tradingkey.com/analysis/cryptocurrencies/btc/261945885-crypto-bitcoin-btc-price-crashing-usd-strategy-fed-tradingkey
- CryptoQuant data on the June crash (Binance Square): binance.com/en/square/post/330619214767985
- Strategy's $101M Bitcoin buyback after the sale (June 8, 2026): bitcoinfoundation.org/news/bitcoin/strategy-buys-101m-in-bitcoin
- Fortune analysis: Saylor's preferred stock death spiral risk (June 9, 2026): fortune.com/2026/06/09/michael-saylor-strategy-math-problem-death-spiral-bitcoin-price
- Bitcoin ETF outflows: 13-day $4.4B record (June 2026): bitcoinfoundation.org/news/crypto-etfs-news/etf-outflows-june-first-week
- Q1 2026 institutional ETF reduction (Amberdata analysis): blog.amberdata.io/institutional-crypto-flows-2026-market-analysis
- Ethereum 60% drawdown analysis (Investing.com): investing.com/analysis/ethereums-60-drawdown-shows-why-it-is-lagging-bitcoin-in-2026-200682271
- BlackRock ETHB staked Ethereum ETF (launched March 2026): blackrock.com/us/individual/products/348532/ishares-staked-ethereum-trust-etf
- Dollar-cost averaging explained (Investopedia): investopedia.com/terms/d/dollarcostaveraging.asp
- Crypto DCA guide (Fidelity): fidelity.com/learning-center/trading-investing/crypto/dollar-cost-averaging
- Best DeFi protocols for stablecoin savings 2026: bleap.finance/en-us/blog/best-defi-protocols-for-savings
- Stablecoin yield comparison tool (Spark): spark.money/tools/stablecoin-yield-comparison
- Can Bitcoin crash to $20K in 2026? (bearish scenario analysis): bitcoinfoundation.org/news/analysis/can-bitcoin-crash-to-20k-in-2026-what-could-trigger-a-historic-market-collapse






