
For more content like this tip me if you can! thank u :)
BTC Analysis
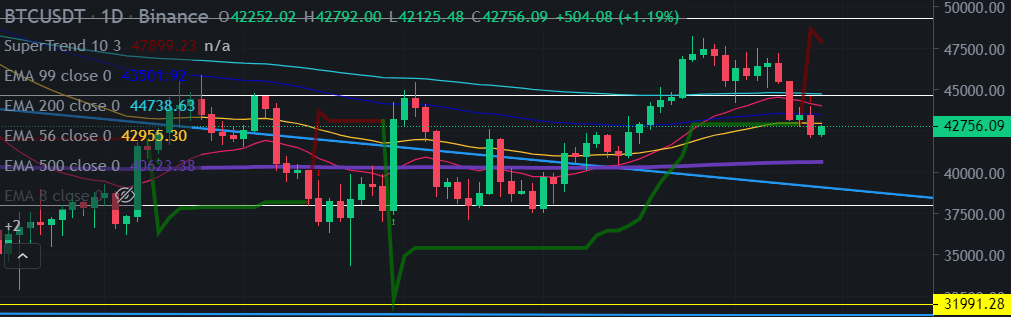
BTC made a huge selling day yesterday, which is not good considering the support is at 43K and now is below it but that doesn't mean it's gonna go down, for now it just break and could still hold today but is today doesn't come back to 43K it will be a very bearish sign.
FTM Analysis
FTM caching some support at EMA500, it could break today or it could hold and break next week.

BNB Analysis
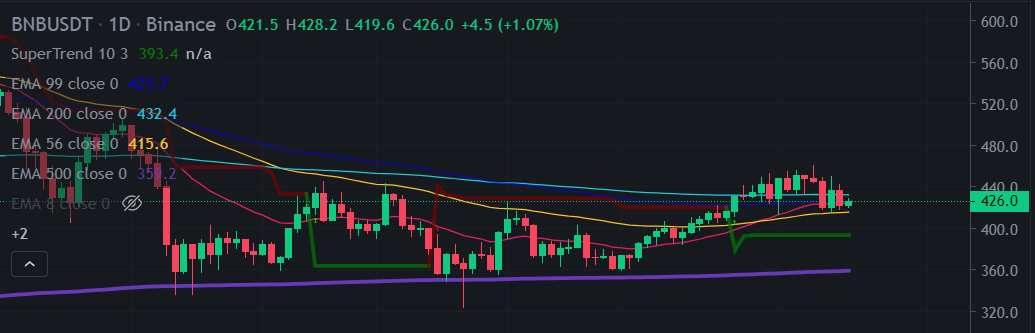
BNB is still above EMA56 but with BTC going down it could break below today.
ETH Analysis
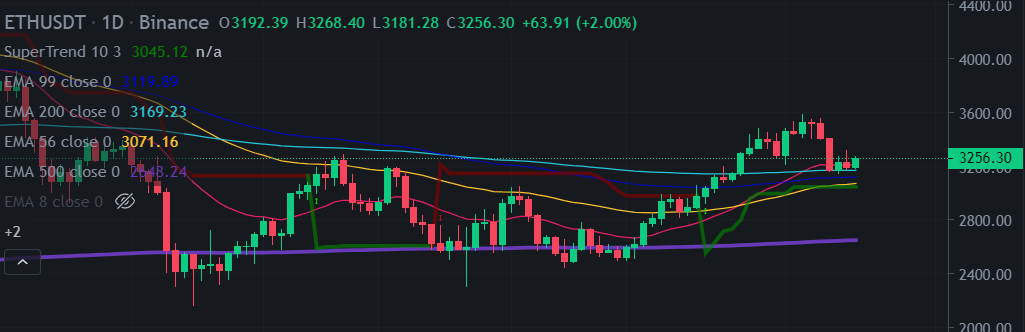
ETH is still good too but it could do a huge selling day if btc goes down again like 4 days ago. But for now is still bullish above EMA56.
Are you a good gamer? Pipeflare is giving 2000$ per month to players who can get the best scores in their games Playing for 15 min, don't lose this opportunity!
Supertrend Indicator Daily and Weekly
_____________________________________________
BTC | Weekly chart | Down Trend |
| Daily chart | Down Trend |
_____________________________________________
ETH | Weekly chart | Down Trend |
| Daily chart | Up Trend |
_____________________________________________
FTM | Weekly chart | Down Trend |
| Daily chart | Down Trend |
_____________________________________________
BNB | Weekly chart | UP Trend |
| Daily chart | Down Trend |
_____________________________________________
RSI Indicator
ETH and BNB are having support at 50 but BTC and FTM are breaking it and the more they stay below it the more chances we get to go to another bear market.
BTC

ETH

FTM

BNB

Suports and resistences
_____________________________________________
BTC | Suport -> 42.5K
| Resistence ->44.5K
______________________________________________
ETH | Suport -> 3150$
| Resistence ->3300$
_____________________________________________
FTM | Suport -> 1$
| Resistence -> 1.50$
______________________________________________
BNB | Suport -> 400$
| Resistence -> 450$
______________________________________________
Volume (in the last 7 days)
.
_____________________________________________
BTC | 55K -> 52K Lower.
______________________________________________
ETH | 443K->423K Lower.
_____________________________________________
FTM | 141M->168M Bigger.
______________________________________________
BNB | 845K->624K Lower.
______________________________________________


