Hive price can not go down after breaking down 5 cent. There may be a triple bottom pattern on Hive price chart. I shared a few analysis about Bitcoin price chart. There was possible same pattern on Bitcoin price chart.
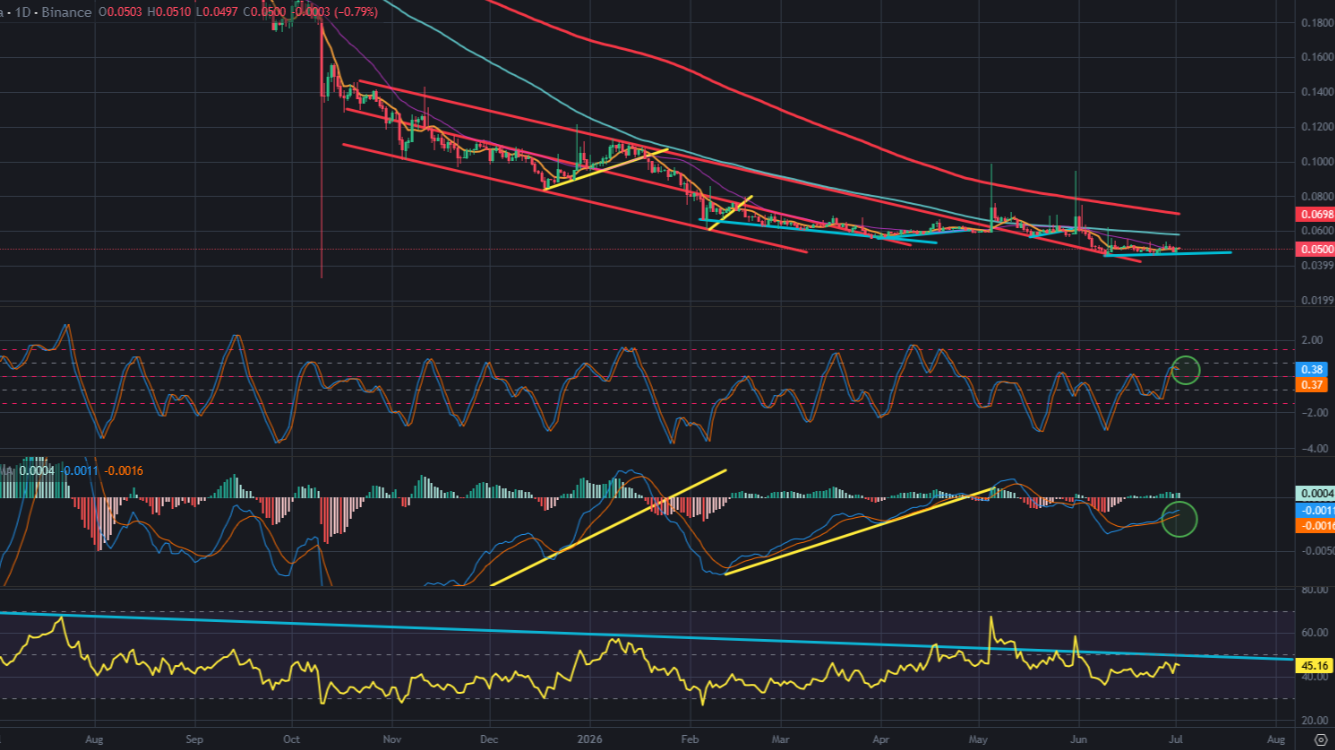
Here you can see daily chart of Hive price. There was great descending channel on Hive price chart. After breaking up this channel, Hive price touched 200-day moving average. It tested to break up this average for two times but I could not..
After reversing down from this average, Hive price touched the top line of this descending channel. After retesting this great descending channel, Hive price supported by mini support line for three times. It may be triple bottom pattern.

Here you can see the indicator on daily chart of Hive price. Fisher Indicator is at the middle level. There is no signal for bullish move for short term.
MACD Indicator is below 0 level. It should reverse up.
There was great downtrend line on RSI Indicator. Even it is broken up, we can not see bullish moves on Hive price chart.

Hive price is waiting for Bitcoin price. Bitcoin price is at the corner of the cliff. If it falls down, we will meet another market crash on crypto market. If not, Hive price may be supported by this triple bottom pattern.


