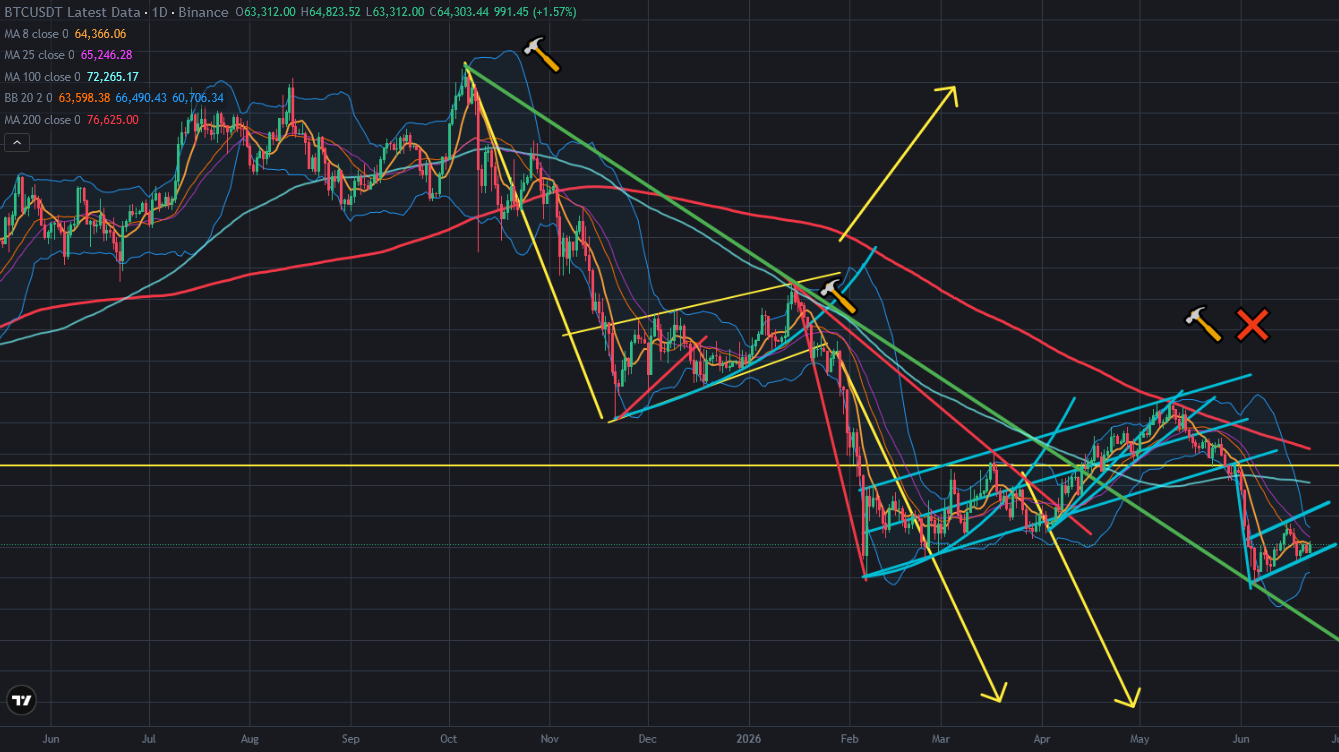
Bitcoin price is in mini ascending channel. It is smaller than previous one. You can see what happened when Bitcoin price broke down great ascending channel. I shared lots of analysis about this great ascending channel and It is broken down. Bitcoin price went down 30% after breaking down this great ascending channel.
Here you can see daily chart of Bitcoin price. Bitcoin price is resisting by the middle line of Bollinger Bands. Bollinger Bands is narrowed. We may see huge price moves on Bitcoin price chart. If we see bearish move, Bitcoin price will break down mini ascending channel. We will meet another market crash if this scenario happens.

Here you can see the indicators on daily chart of Bitcoin price. There was mini uptrend line on RSI Indicator and It is broken down. If we see the result of this mini breaking down, we may see breaking down ascending channel.
Fisher Indicator is trying to reverse up from the middle level. MACD Indicator is trying to reverse up and go up below 0 level.
We can not see clear reversing up these indicators.

So we may see another bearish wave on Bitcoin price chart. USA-Iran meeting will show us possible future. We may see another market crash. We should be careful for this possibility.
We will see..