
Hello Everyone! in This tutorial we are going to analyze bitcoin price Since 2019-3-24 to 2020-3-24 using Python
Before we start, Make Sure To download these third-party libraries
- Pandas (Essential )
- matplotlib ( inessential )
So Let's Start!
First Thing I am going to import Pandas
why do we need Pandas ?
Pandas is an open-source, BSD-licensed library providing high-performance, easy-to-use data structures and data analysis tools for the Python programming language.

And Here I Just imported Pandas As pd so we can write it easily
and imported matplotlib
Now I have A CSV File that contains The data that I want to analyze.
You Can Download it From This Link
The Following Code is what we'll use to read a CSV file
You Can Print It easily by writing Print(df)
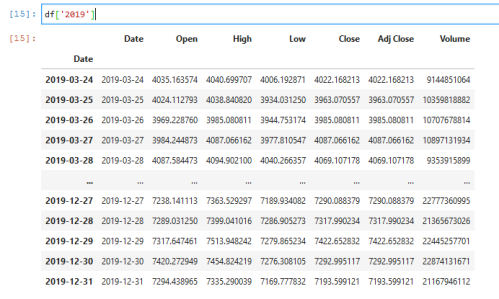
Now if we looked into our CSV file column(date)

Pandas Read This Date time as String so it Cant Deal with it, so we should convert it to A date/time .
how can we do that?
we can do that easily by this Code

in this code, I just accessed date column by df['Date']
and I used pd.to_datetime which is an inbuilt function in pandas that converts a string to a date/time.
pandas cant convert it automatically without us telling it how our date is formatted, so what we need to do here is pass in a format string specifying how dates are formatted so in this case, our date is 2020-3-24
which is Year-Month-Day, in formating code, it will be %Y-%m-%d
You can find these Codes Here
Now I will set index to the date column

why did we do that?
well it more reasonable to set our index to our date column
so if we want to access the price of bitcoin on that particular date we can easily do that
we're almost done.
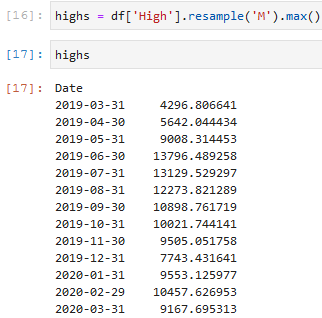
in this code, I accessed high column which is the highest price of bitcoin
and resample it Monthly and now we have to tell it what we are gonna do with this resampling, well we just want the max value for each of these months, so if we print it out we can see the highest price of bitcoin every month, you can resample it daily or whatever you want, you can find this codes here
and now what is matplotlib ?
Matplotlib is a 2D plotting library which can be used to generate publication quality figures.
we have imported matplotlib at the beginning

and that's all we want!
Hope That Was Helpful <3


