

The median indicator is one of the many technical indicators that fall under the category of trend-based. When it comes to technical analysis and trading, indicators play a very important role in not only predicting price direction but also making effective trading decisions. Trend is a very important term when it comes to predicting price direction in a particular time period.
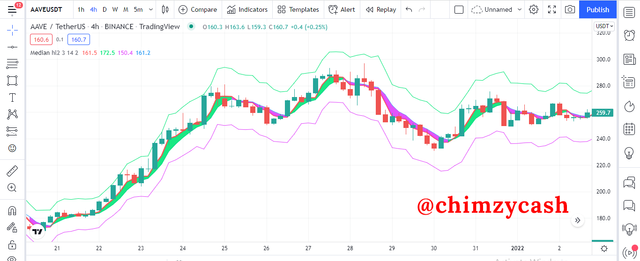
It's a technical indicator that can be used to measure volatility and price direction in the market. The median indicator makes use of a channel that forms based on how the ATR value moves away from the middle of the range value within a selected period. Also, the parallel bands that is gotten from the average true range ATR value shows the price volatility. On the Average True Range ATR of the median indicator, the ATR is plotted above the median line and below the median line which is used for determining volatility of the price. The way the median indicator works is that it shows the median value of the average between the highs and the lows within the specified length and the median is compared to the exponential moving average EMA of the same period length.
On the median indicator, there is a coloured cloud which is basically the space or the difference between the median and the exponential moving average EMA, which shows depending on which has higher values. The coloured cloud on the median indicator visually represents the direction of the market in terms of uptrend and downtrend. When the cloud shows a green colour, it is an indication that the market is bullish and the median value is higher compared to the exponential moving average EMA. Also, when the cloud shows a purple colour, it is an indication that the market is bearish and the median value is lower compared to the exponential moving average EMA.
.png)
Median Indicator added on the AAVE/USDT chart on tradingview
Uptrend from Median indicator
Identifying and Determining trends whether uptrend or downtrend is one of the main strengths of the median indicator as it is a trend-based indicator which is great for buy and sell signals. The cloud that is formed on the median indicator signals the trend direction in the market and changes colour based on the direction of the trend. For uptrend, the cloud changes to green color and the median value or median line is above the EMA value. This means that the market is bullish or moving in an uptrend direction and that the buyers have taken control of the market.
.png)
From the BNB/USDT chart, we can see the median indicator identifying the change in trend direction to the upside as the cloud colour changed from purple to green which is an indication that the buyers are about to take control of the market and the price is about to move in an uptrend direction. After the cloud colour changed from purple to green, we can see that what followed next is an uptrend price movement. Once this signal is identified, it becomes a good buy signal for a buy trade.
Downtrend from Median indicator
Identifying downtrend using the median indicator is what makes the median indicator such a powerful tool used during technical analysis for identifying trends in the market. As always, the median indicator is a trend-based indicator which is also great for sell signals. The cloud that is formed on the median indicator signals the trend direction in the market and changes colour based on the direction of the trend. For downtrend, the cloud changes to purple color and the median value or median line is below the EMA value. This means that the market is bearish or moving in a downtrend direction and that the sellers have taken control of the market.
.png)
From the BNB/USDT chart, we can see the median indicator identifying the change in trend direction to the downside as the cloud colour changed from green to purple which is an indication that the sellers are about to take control of the market and the price is about to move in a downtrend direction. After the cloud colour changed from green to purple, we can see that what followed next is a downtrend price movement. Once this signal is identified, it becomes a good sell signal for a sell trade.






