
Greetings! In this article, I will go over my technical analysis I did today and explain what indicators were notable and future potential scenarios of the Ethereum price action.
1.45k Incoming?
During the past couple of days, Ethereum has been on a constant downward trajectory. It went from the 1.73k price point, which was the 200 EMA, down towards the 1.63k price point. This rejection is very bearish for numerous reasons that I will get into now.
4-hour time frame:
While the other timeframes seem bearish, the 4-hour timeframe seems to be bullish. This is primarily due to the fact that Ethereum has been on a constant downward trajectory for the past couple of days straight. The RSI is nearly at oversold territories and the MACD is looking like it will form a bullish cross within the next couple of days or so. These indicators indicate that potentially, the current low at 1.63k is the higher low in an overall bullish divergence. However, despite the next couple of days being bullish, there are some important indicators to mention on the daily timeframe as well.
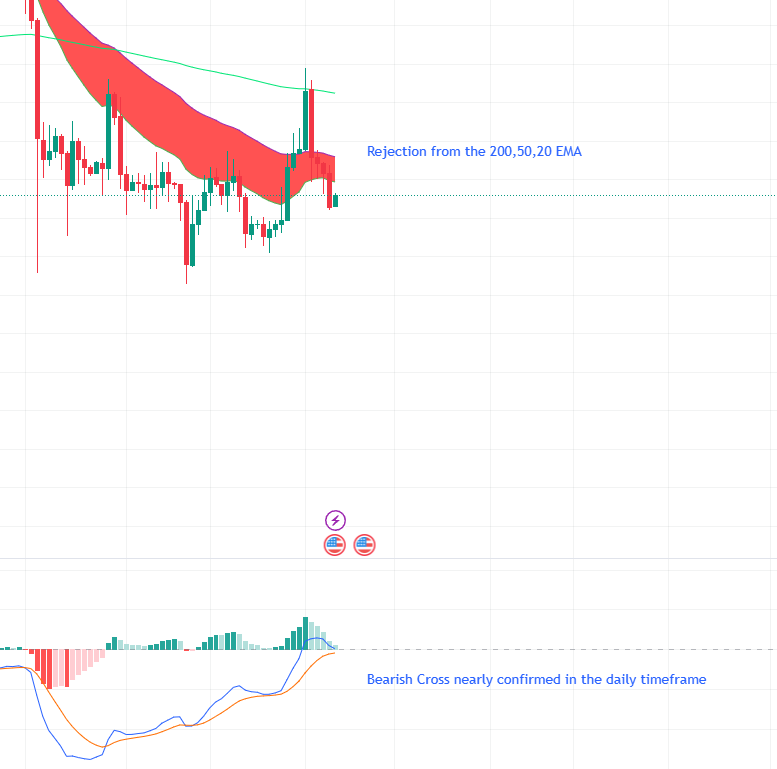
24-hour time frame (Daily time frame):
In the daily timeframe, it Ethereum looks very bearish. For starters, the Ethereum price couldn't find support at the 50 or 20 EMA levels. Connecting back to the 4-hour time frame, it is unlikely that the next upside move will be enough to break through the 20, 50, and 200 EMA levels on the daily timeframe. Next, the MACD has nearly formed a bearish cross, meaning that most likely, Ethereum will be looking to go down towards 1.5k levels once again. Furthermore, if the daily RSI goes back down into RSI resistance, then it is very likely that Ethereum could go down to 1.45k.
Weekly time frame:
In the weekly time frame, Ethereum's RSI had a rejection from RSI resistance. This means that within the next couple of weeks or months, Ethereum could be seeking much lower price targets, especially given the macroeconomic situation of the U.S. Furthermore, the price went all the way down to the 200 EMA once again. Given the other indicators, Ethereum could definitely potentially break below the 200 EMA and reach 1.45k.
Conclusion
Overall, despite the next couple of days looking bullish, the next couple of weeks/months for Bitcoin look bearish, with the definite possibility of hitting the low 1.5k levels, or potentially even 1.45k, given the unstable macroeconomic situation of the U.S.


